0x Price Analysis ZRX / USD: Bullish Consolidation
0x is holding above its moving averages with little variation.

Share this article
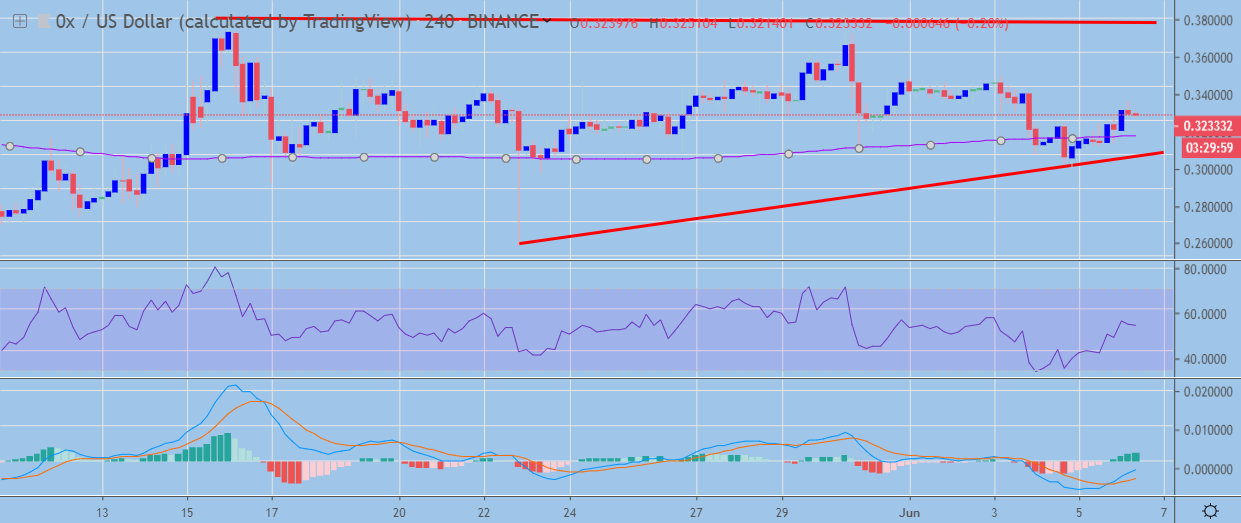
- 0x has a bullish short-term bias, with the cryptocurrency trading above its 200-period moving average on the four-hour time frame
- The four-hour time frame shows a bullish ascending triangle pattern
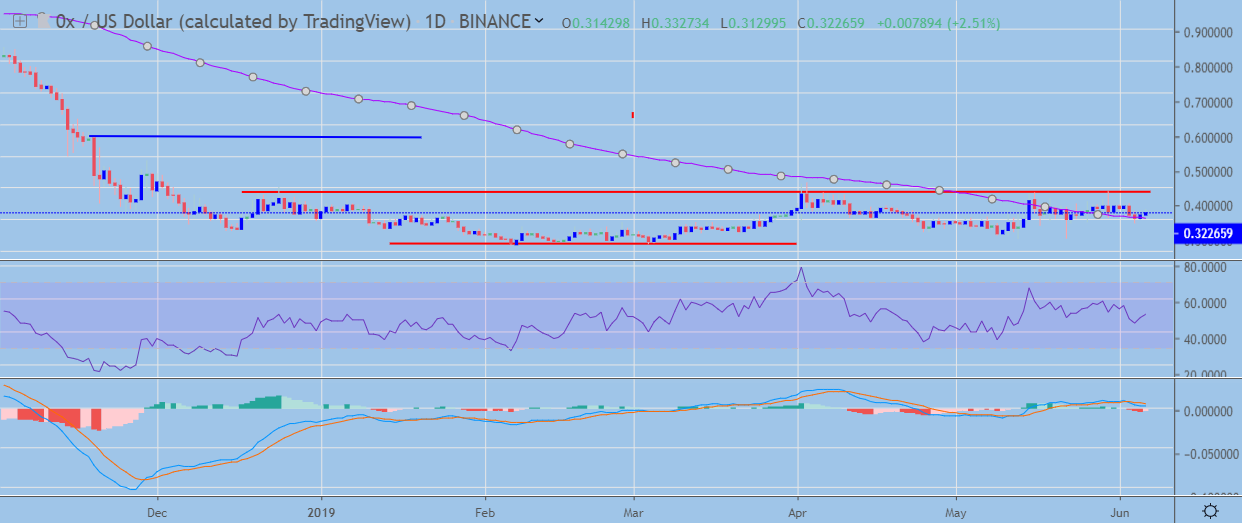
- The daily time frame continues to show a large inverted head and shoulders pattern
0x / USD Short-term price analysis
0x has a bullish short-term bias, with the cryptocurrency still trading above its 200-period moving average on the four-hour time frame.
The four-hour time frame also shows that an ascending triangle pattern has now formed, with the ZRX / USD pair attempting to move away from key trendline support.
Technical indicators on the four-hour time frame are bullish and continue to generate a buy signal.
 ZRX / USD H4 Chart by TradingView
Pattern Watch
Traders should note that ascending triangle patterns are typically considered bullish continuation patterns.
Relative Strength Index
The RSI indicator is bullish on the four-hour time frame and shows scope for further upside.
MACD Indicator
The MACD indicator has turned bullish on the four-hour time frame and is currently generating a strong buy signal.
0x / USD Medium-term price analysis
0x has a bullish medium-term outlook, with the cryptocurrency continue to hold price above its trend defining 200-day moving average.
The daily time frame is showing that a valid inverted head and shoulders pattern remains present, with the large bullish pattern yet to be triggered into action.
Technical indicators on the daily time frame are mixed and are currently failing to generate a clear trading signal.
 ZRX / USD Daily Chart by TradingView
Pattern Watch
Traders should note that the November 19th, 2018 swing-high remains the bullish target of the inverted head and shoulder pattern on the daily time frame.
Relative Strength Index
The RSI indicator on the daily time frame is neutral and is currently failing to generate a clear trading signal.
MACD Indicator
The MACD is also neutral on the four-hour time frame and is failing to provide a conclusive trading signal.
Conclusion
0x continues to hold onto its short and medium-term bullish trading status, with the cryptocurrency currently in consolidation mode above its key moving averages.
The daily time frame continues to show a valid bullish pattern, which if fully ignited would see the ZRX / USD pair almost double in value from current trading levels.
Check out our guide to the 0x DEX network.
Our deep dive DARE into the project is available here.
