XRP Moves Above $1 For the First Time in 3 Years
Technical indicators suggest that investors could take advantage of XRP’s recent price action to exit underwatered positions.

Key Takeaways
- XRP has risen by more than 80% in the past 48 hours.
- The sudden uptick pushed its price past $1 for the first time in three years.
- While speculation mounts are this cryptocurrency, several sell signals are emerging in the lower time frames.
Share this article
Following a massive price explosion over the past two days, XRP rose to a three-year high of $1.10.
XRP Makes New Yearly High
Ripple’s XRP made headlines after rising above the $1 mark for the first time since mid-February 2018. The sudden upswing came after the fourth-largest cryptocurrency by market capitalization broke out of an inverse head-and-shoulders.
This altcoin surged to a high of $1.10, extremely close to the inverse head-and-shoulders’ target of $1.13.
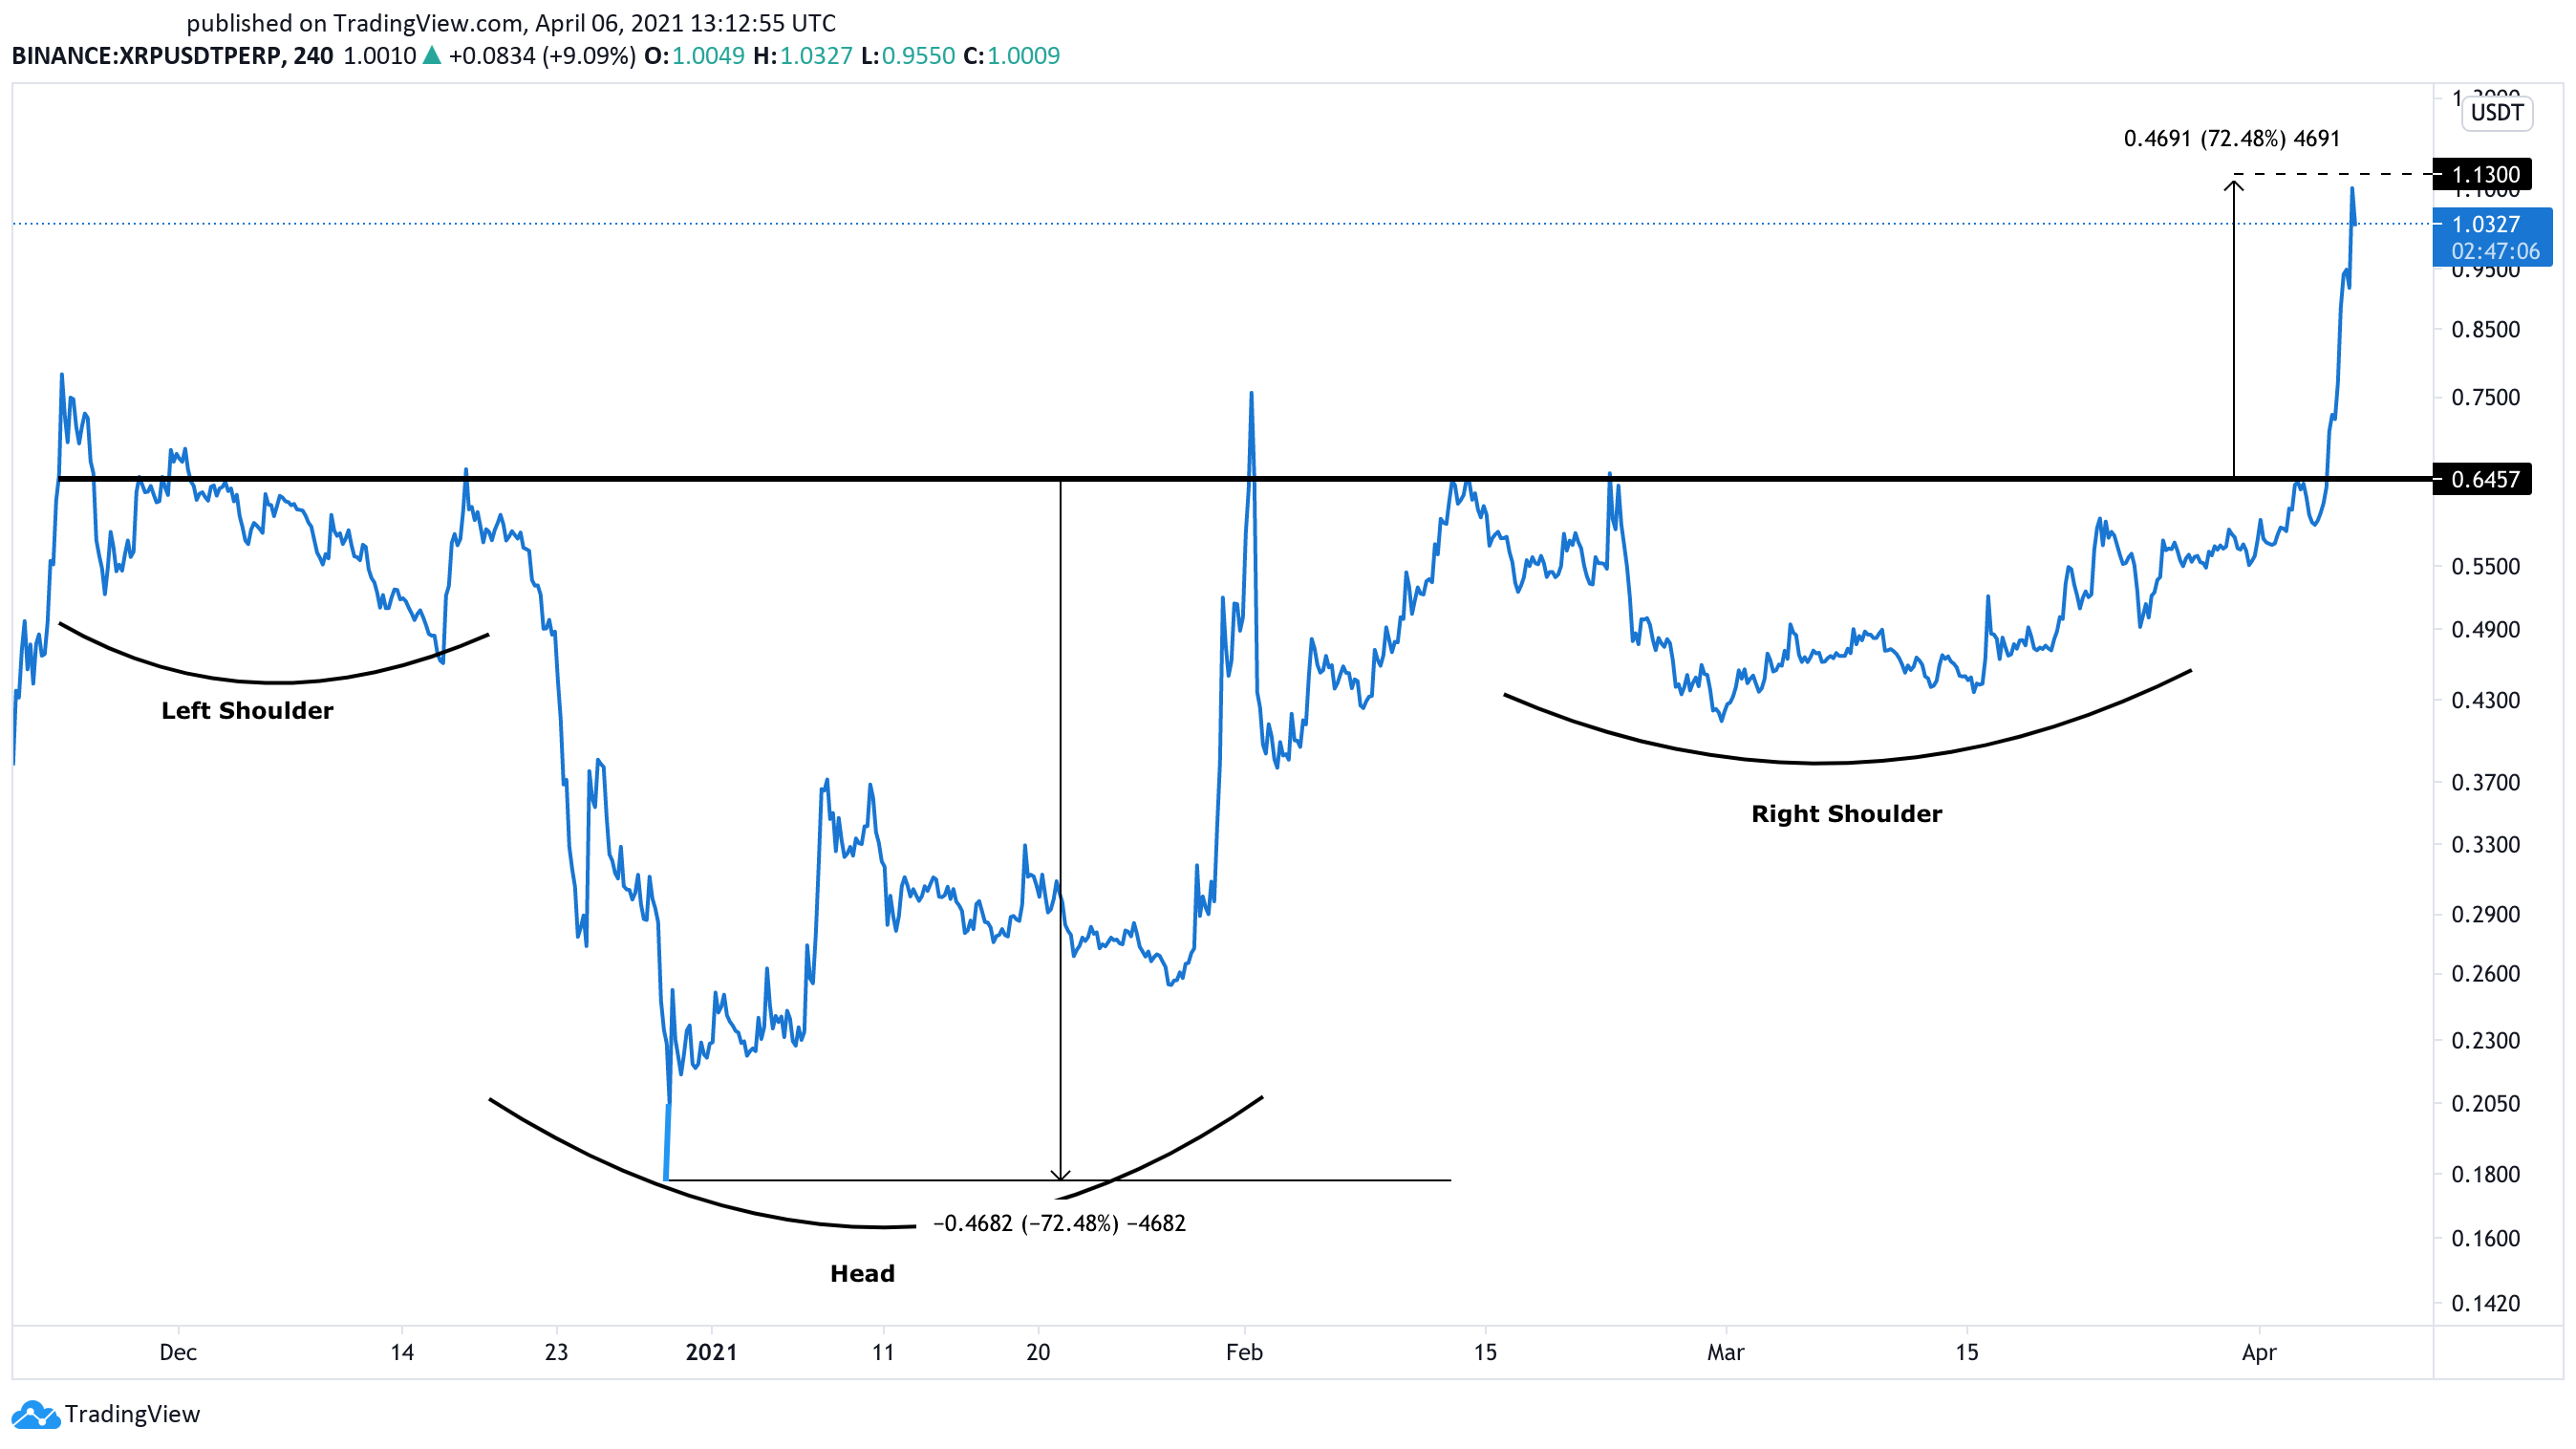
Given the significance of the bullish momentum behind XRP, investors could take advantage of the recent price action to book profits.
Profit-Taking Halts the Rally
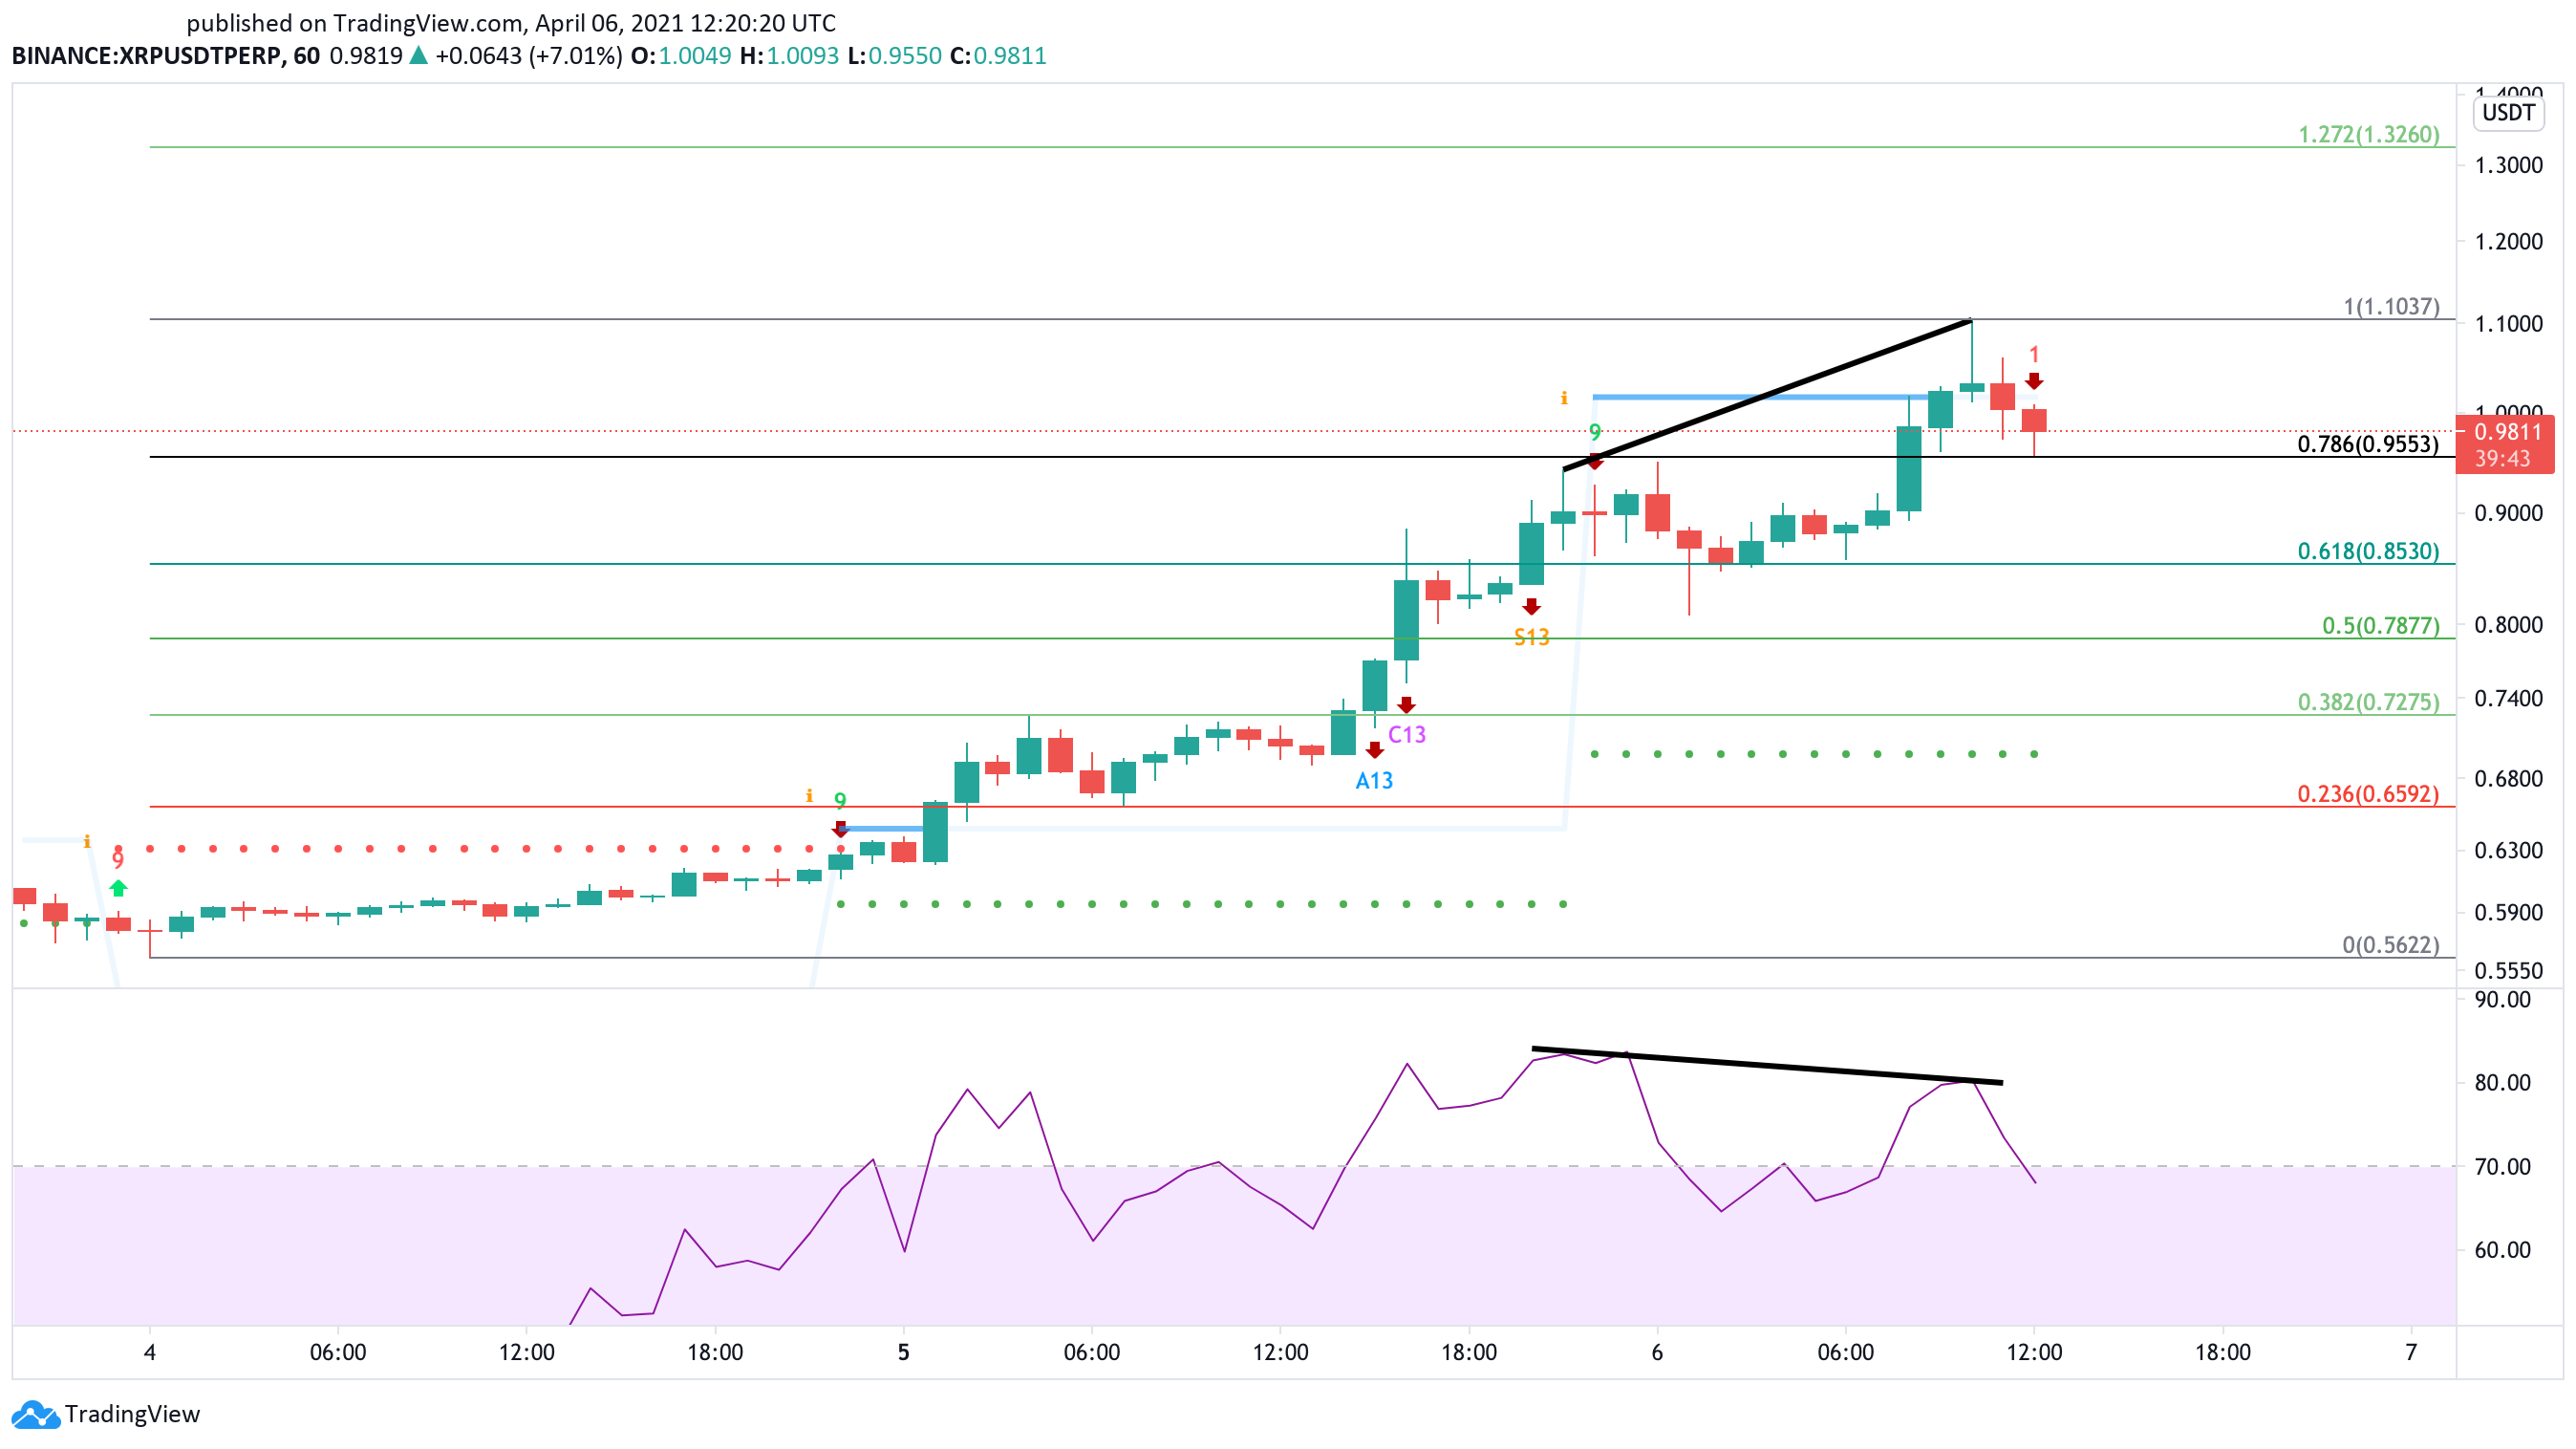
The short-term pessimistic scenario is corroborated by the emergence of several bearish signals on the token’s hourly chart.
For instance, the Tom DeMark (TD) Sequential indicator presented a sell signal in the form of a green nine candlestick, which has transitioned into a red one candle due to the spike in profit-taking. The bearish formation forecasts a one to four hourly candlesticks correction before the uptrend resumes.
The development of a bearish divergence between XRP’s price and the Relative Strength Index (RSI) adds credence to this thesis. While this altcoin was making a series of higher highs, the RSI created lower lows.
Such behavior, especially when the RSI is above the 80 mark, indicates trend exhaustion is near.
If market participants were to realize profits around the current price levels, XRP might lose the 78.6% Fibonacci retracement level at $0.96 as support. Moving past this crucial hurdle could trigger a downswing to the 61.8% or 50% Fibonacci retracement level.
These interest areas sit at $0.85 and $0.79, respectively.
Regardless of the mounting bearish signals on the lower time frames, the cryptocurrency market’s speculative nature makes it impossible to disregard the bullish outlook.
Further buying pressure behind XRP that sends it above the recent high of $1.10 may be significant enough to invalidate the TD’s sell signal. Under such unique circumstances, XRP could shoot up to the 127.2% Fibonacci retracement level at $1.33.
Disclosure: At the time of writing, this author owned Bitcoin and Ethereum.
Share this article
