Altcoin Dominance Rising: Ethereum Leads, XRP and Litecoin Lag
The altcoin market returns with a vengeance

Share this article
Altcoin dominance broke above a significant resistance level, suggesting a further advance. The upswing could indicate the beginning of a new “altseason.”
Altcoins Could Gain Significant Market Share
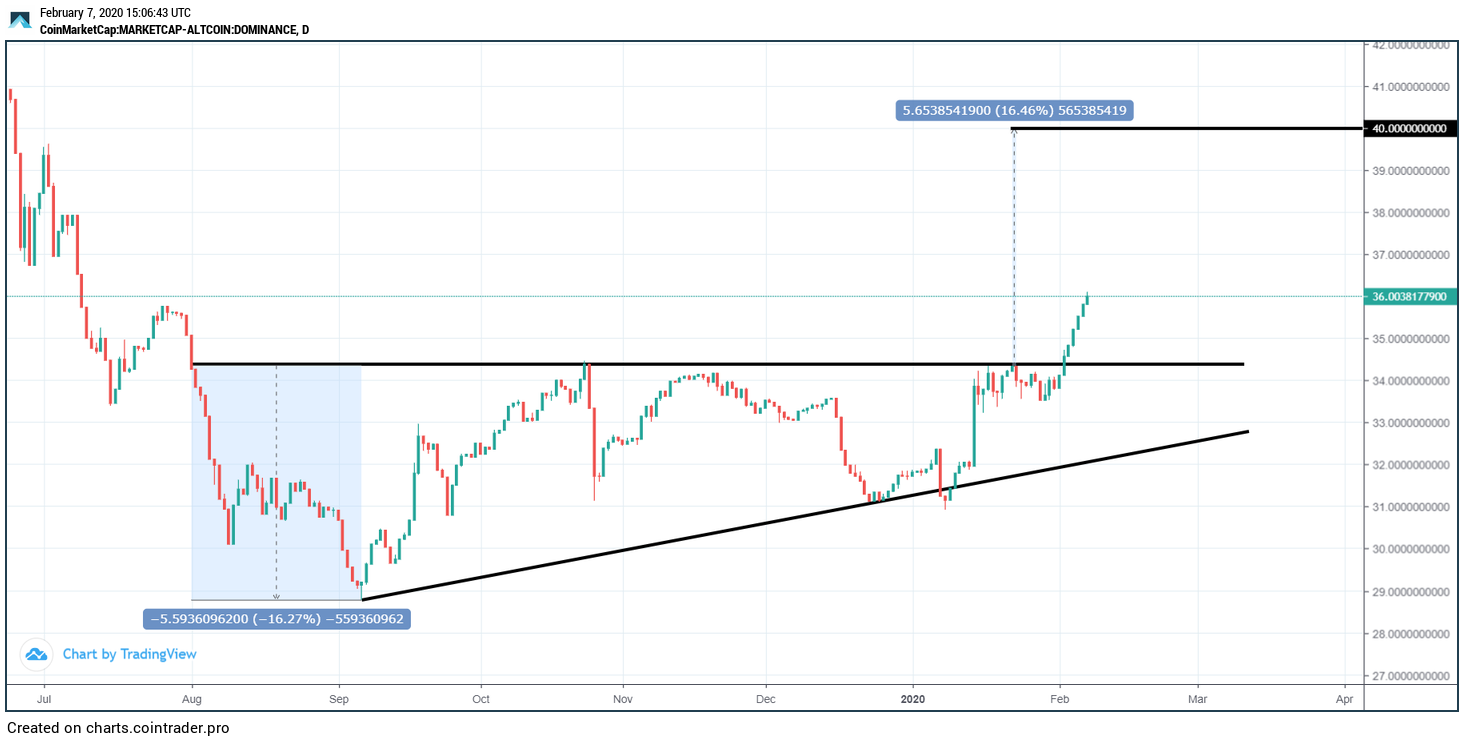
At the peak of the 2017-18 bull market, altcoins were able to dominate over 67% of the entire cryptocurrency market capitalization. However, the last two years have throttled altcoin market share.
In early September 2019, altcoin dominance hit a low of 29%. Since then, an ascending triangle started forming on its 1-day chart. The altcoin price action shows a horizontal line across the swing highs and a rising trendline around the swing lows.
Earlier this month, altcoin dominance broke out of this continuation pattern, signaling the beginning of a new “altseason.” By measuring the height of the triangle, at its thickest point, and adding it to the breakout point, this technical formation estimates a 16% target to the upside. If validated, altcoins could soon capture 40% share of the entire cryptocurrency market.
A look at Bitcoin’s dominance chart suggests that such a bullish scenario for altcoins is more likely.
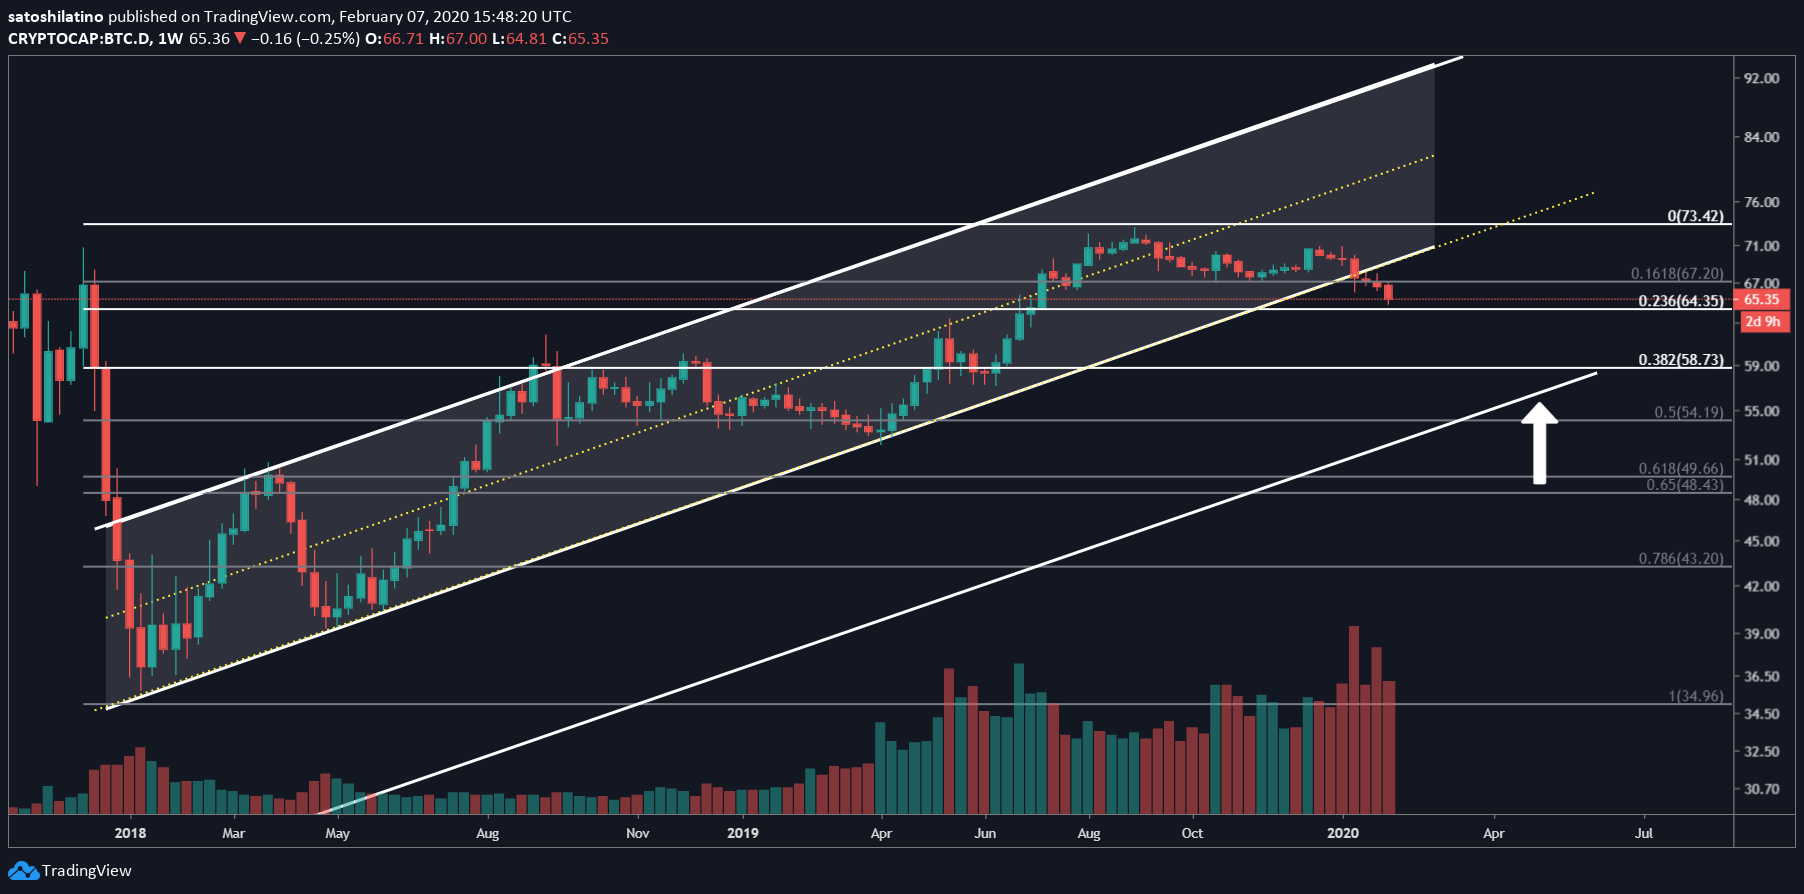
Bitcoin dominance has been contained within an ascending parallel channel since the beginning of 2018. Since then, every time it hits the top of the channel, it retraces to the middle or the bottom. Conversely, when it reaches the lower boundary of the channel, it surges to the middle or the upper boundary.
After moving within this pattern for over two years, Bitcoin dominance broke the lower boundary of the channel in late January 2020. According to 45-years trading veteran Peter Brandt, “there is a tendency when you draw a parallel line equal to the distance of the height of the channel.”
Under this premise, Bitcoin dominance could run into significant support just under 59%. This is also where the 38.2% Fibonacci retracement level sits at.
Altcoins capturing greater market share could also be why multiple bearish signals have been invalidated, allowing the market to continue rising.
Ethereum Leading the Top Three Alts
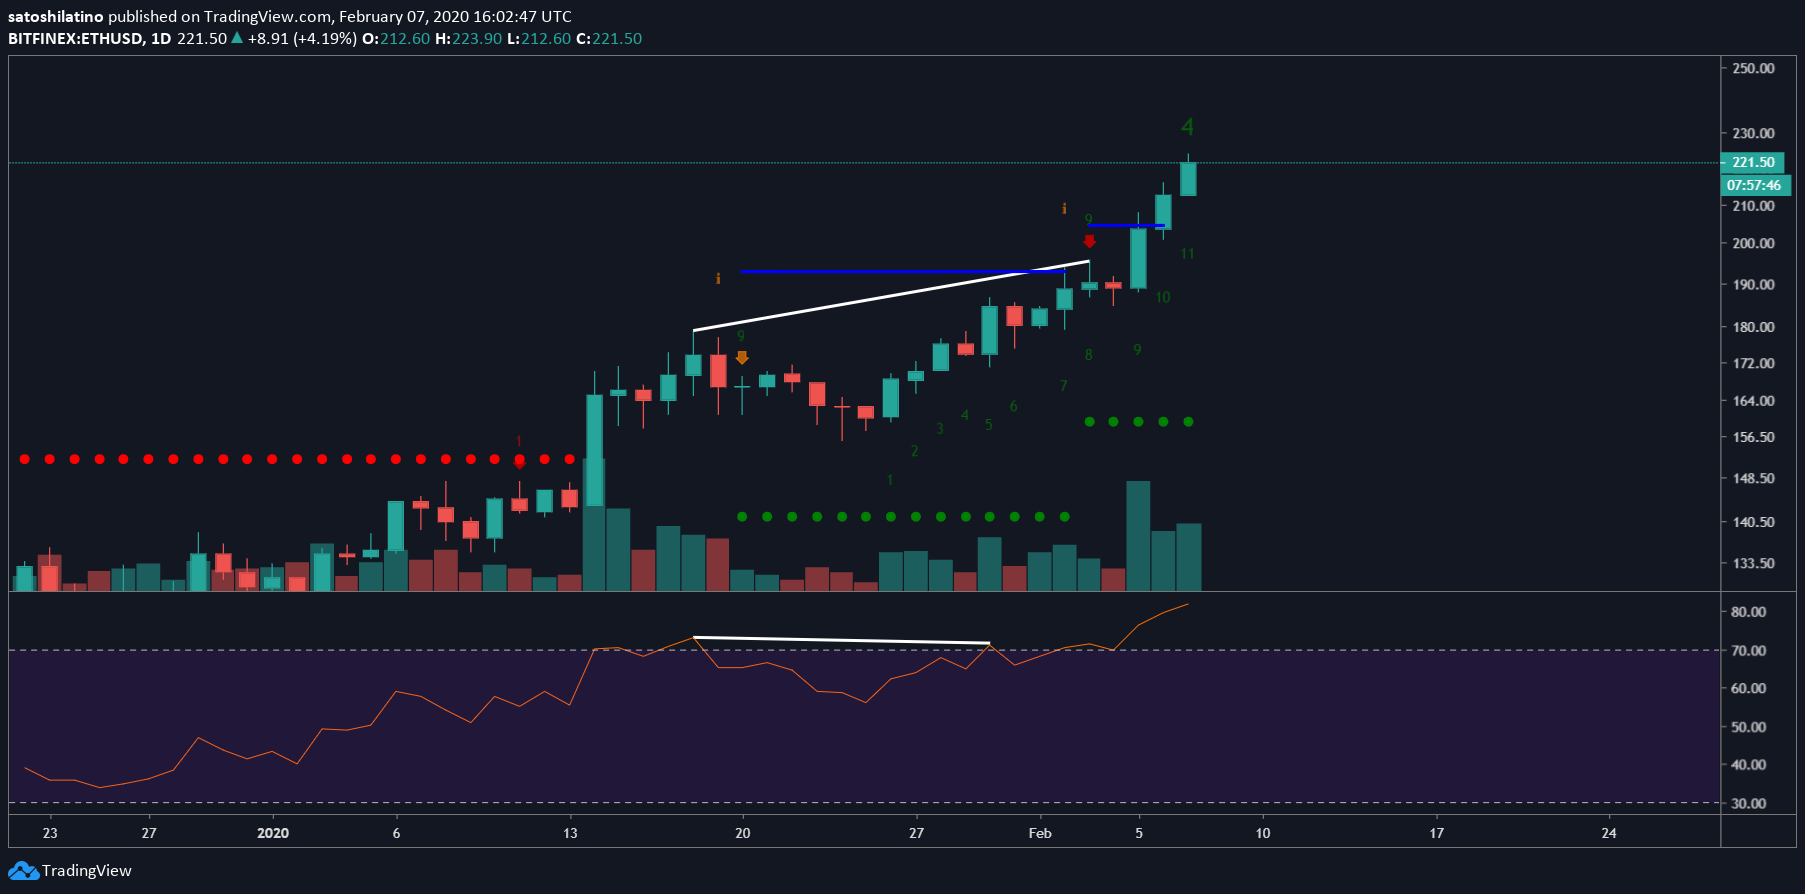
In a recent article, Crypto Briefing explained that Ethereum was bound for a correction based on several technical patterns. The TD sequential indicator, for instance, was presenting a sell signal in the form of a green nine on ETH’s 1-day. The bearish formation estimated a one to four candlestick correction before the continuation of the bullish trend.
Along the same lines, a bearish divergence between the price of Ether and the Relative Strength Index (RSI) added credence to the pessimistic outlook. However, demand for this cryptocurrency increased, pushing its price up and invalidating the bearish signs along the way.
Now, Michaël van de Poppe, a full time trader based in Amsterdam, believes that Ethereum is currently “creating a higher high, just like Bitcoin did with the $14,000 move.” The analyst maintains that if ETH is able to turn the $220 resistance level into support it could “aim for $360 as [the] next major resistance.”
“Whether or not we clear it in one go (or consolidate for a few weeks) doesn’t matter that much, I think we’re breaking it pretty soon. Going towards $360 would be the next test. Clearing $360 and we aim $500 and $600,” said Van de Poppe.
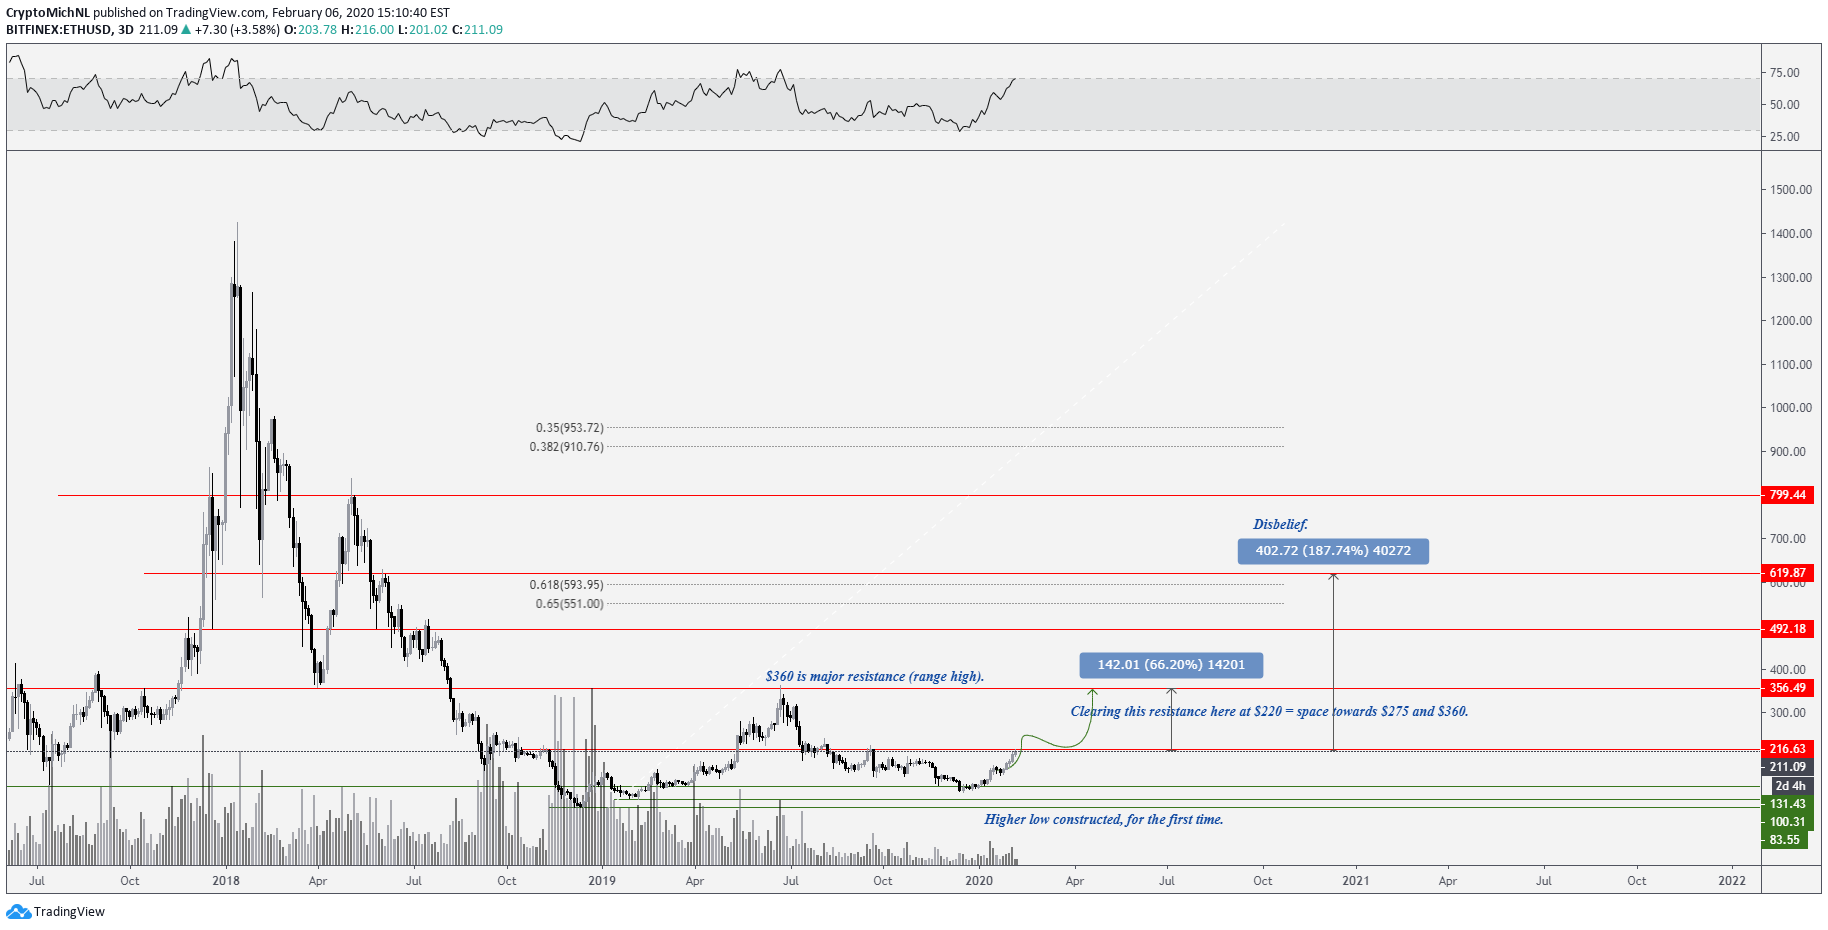
Nevertheless, van de Poppe added that failing to flip the $220 resistance level could trigger a correction. If this happens, he expects a retest of the $193 support level. Following the recent upswing, a correction could be essential to maintain a healthy uptrend before its continuation, explained van de Poppe.
XRP and Litecoin Left Behind
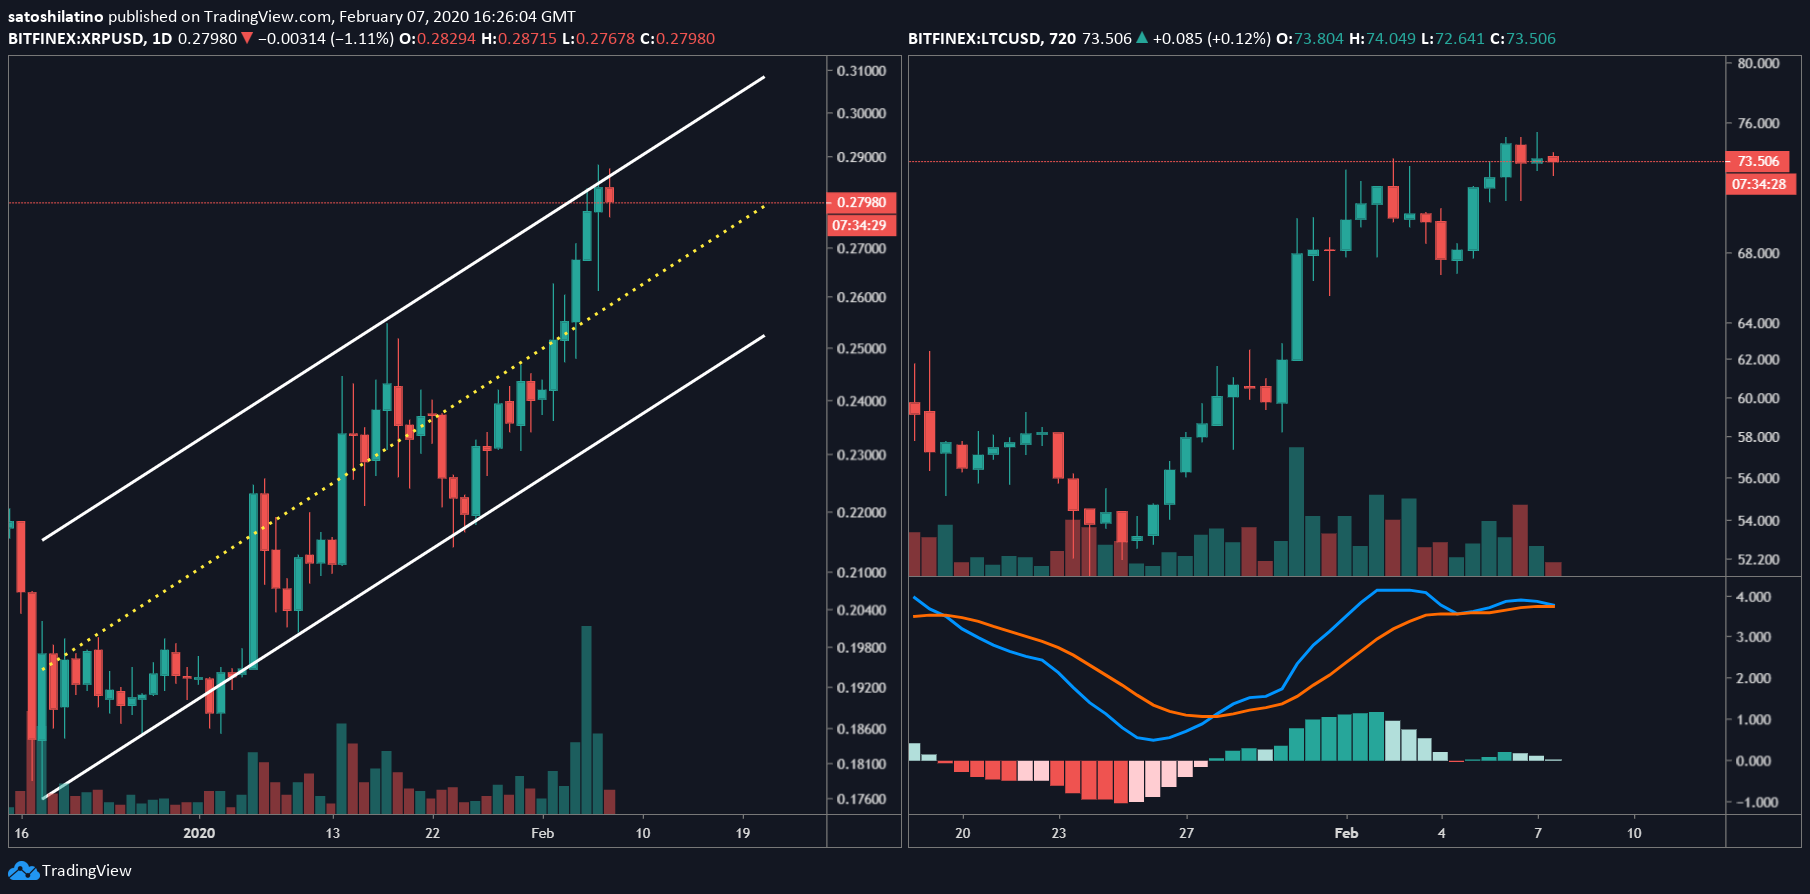
While Ethereum continues climbing higher, XRP and Litecoin have not enjoyed the same type of bullish momentum. In fact, XRP went up just 8% and Litecoin increased 11% since Feb. 5. During that time span, Ether surged just under 20%.
Now, XRP seems to be preparing for a retracement to the middle or the lower boundary of the ascending channel where it has been contained since mid-December 2019. Meanwhile, LTC is consolidating as the moving average convergence divergence, or MACD, is starting to turn bearish on its 12-hour chart.
Moving forward
It is uncertain whether Ethereum will continue surging without a retracement over the next few days. What it is known is that the altcoins dominance chart looks bullish and the Bitcoin dominance chart looks bearish. This could imply an invalidation of the bearish signals seen on XRP and LTC.
However, the Crypto Fear and Greed Index (CFGI) continues sensing high levels of greed among market participants, which is a negative sign. Recently, the CFGI hit a value of 61, which represents greed. The last time this fundamental index was this high was in August 2019, when it was at 66. During that time, the altcoins dominance fell 18%.
Time will tell whether altcoins will continue to enjoy the bullish impulse they have seen since mid-December 2019. Based on the recent price action, it appears that any retracement from now on could serve as an opportunity to let sideliners back into the market. A new inflow of capital would likely push the altcoins higher to finally reach a 40% market share.
Share this article
