Bitcoin and Ethereum Must Fight Post-ATH Sell-Offs
BTC and ETH are experiencing sell-offs following Bitcoin's all-time high, but sentiment remains bullish.
The cryptocurrency market began this week with slumping prices in the aftermath of Bitcoin’s recent all-time highs. Though Bitcoin and Ethereum have significantly retraced in the past 24 hours, both cryptocurrencies hold above crucial support levels that may determine where they are headed next.
Bitcoin Must Hold Above Key Support
Bitcoin’s uptrend appears to have reached exhaustion after prices rose to a new all-time high of $24,400 on Dec. 20. Since then, the cryptocurrency’s price has fallen by more than 6.50%. The downswing pushed Bitcoin to a critical support level that will determine whether prices can fall further.
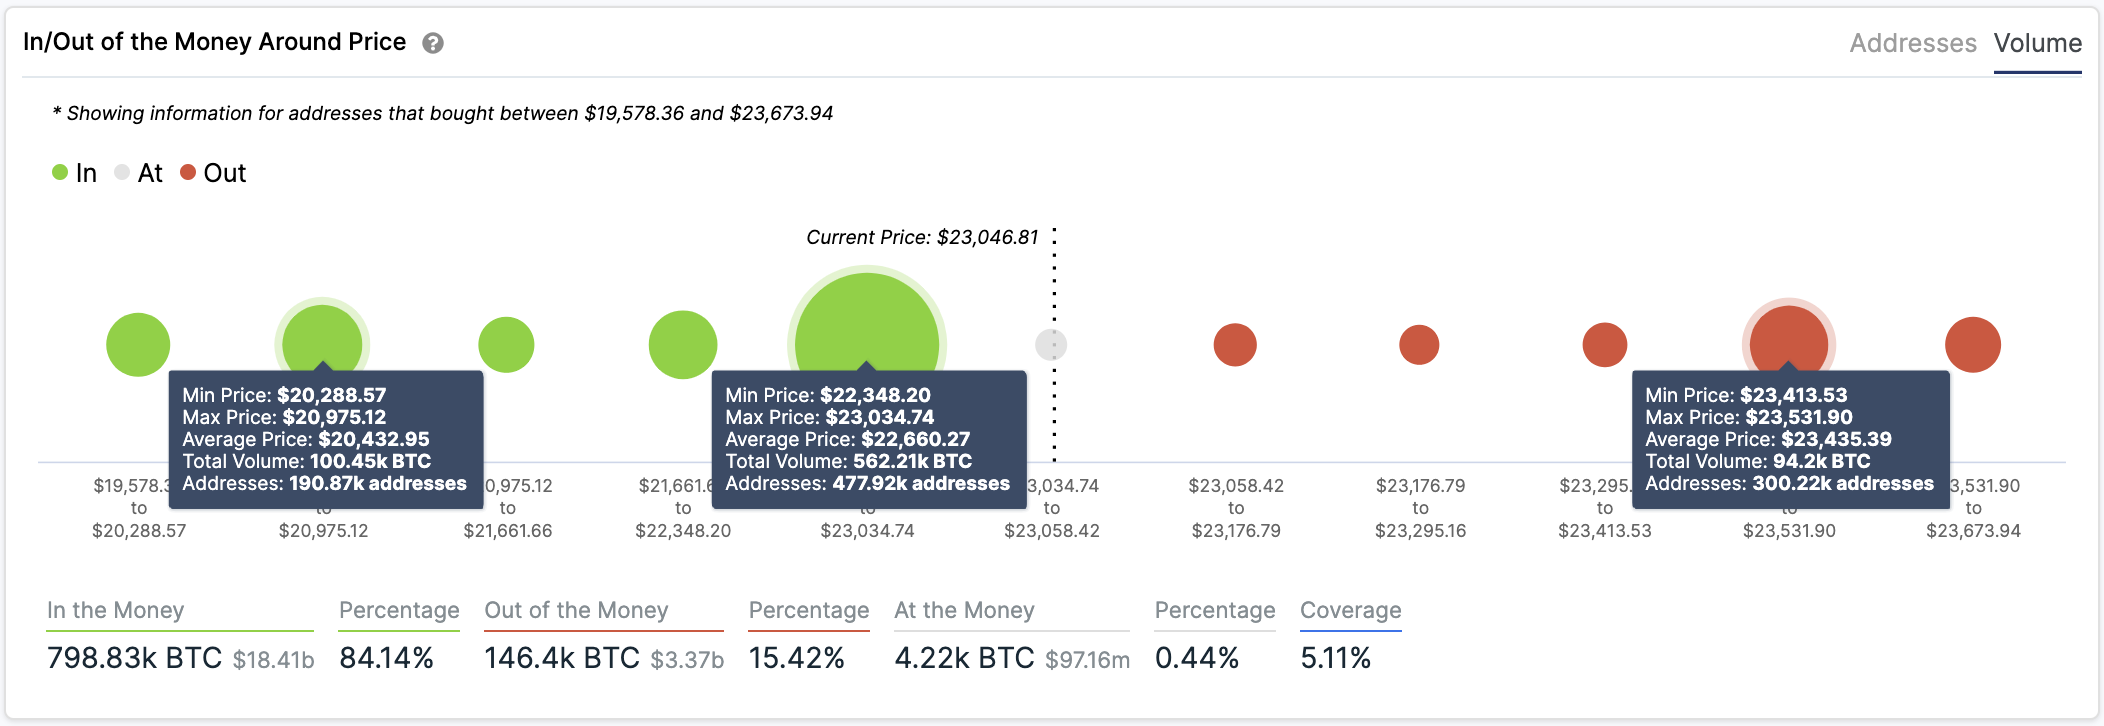
Based on IntoTheBlock’s IOMAP model, the $22,660 support barrier poses a lot of significance to Bitcoin’s trend. Transaction history shows that nearly 478,000 addresses previously purchased more than 560,000 BTC around this price.
Such a vital demand area could absorb some of the recent selling pressure, preventing prices from falling further. On the other hand, if this support level breaks, it could be catastrophic for investors betting on the upside. The IOMAP cohorts show that the next significant interest area reinforcing Bitcoin’s uptrend sits around $20,500.
If the $22,660 support were to break, BTC holders should expect their investments to plunge by another 10%.

Bitcoin Sell Pressure Rising
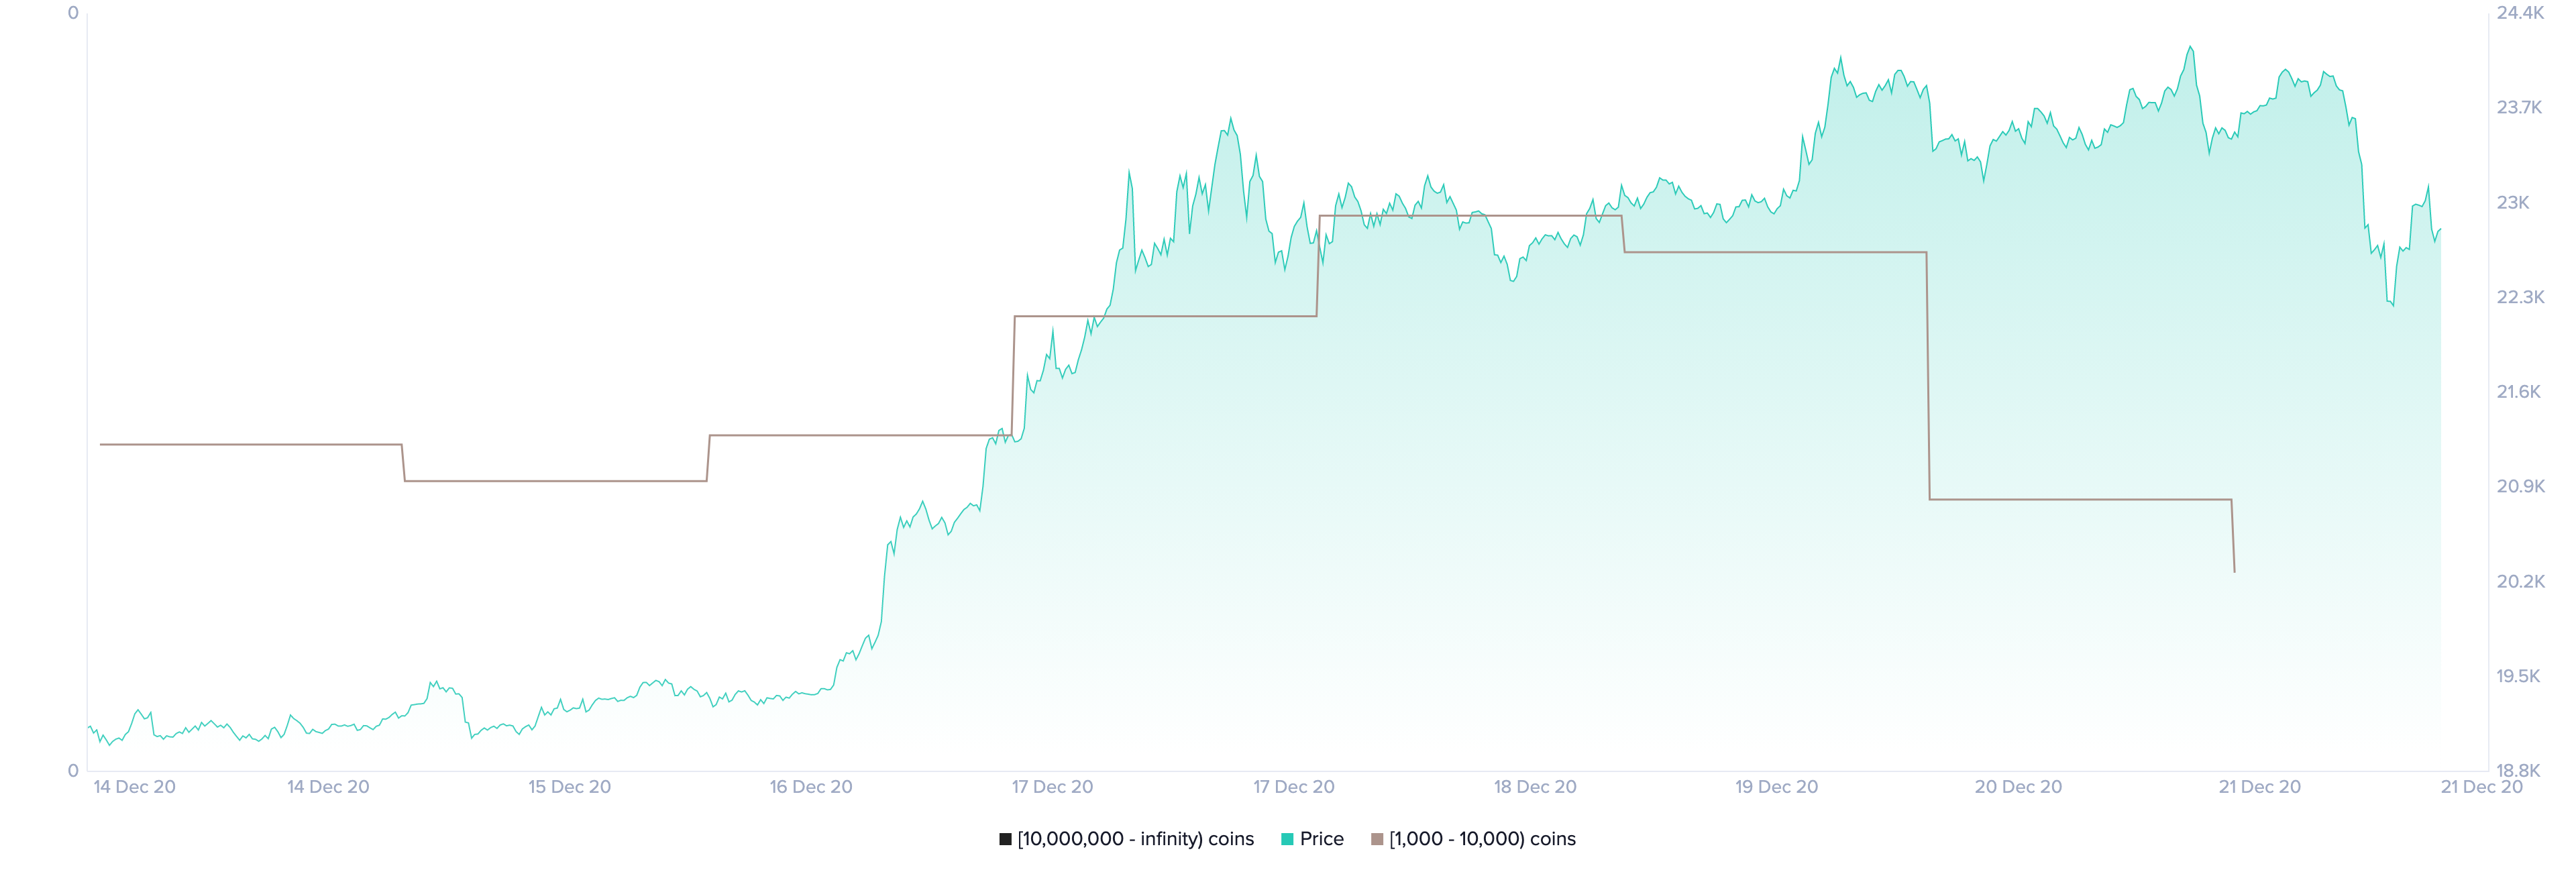
Given the high probability of a steeper correction, it seems that BTC whales have taken advantage of the recent price action to realize profits. Santiment’s holder distribution chart shows that the selling pressure behind Bitcoin rose dramatically over the past few days.

Indeed, the number of addresses holding 1,000 to 10,000 BTC plunged. Roughly 31 whales left the network or redistributed their tokens, representing a 1.40% decline in such a short period.
At first glance, the downtrend in the number of large investors on the Bitcoin network may seem insignificant. However, when considering that these whales hold between $23 million and $230 billion in BTC, the sudden spike in sell orders can translate into billions of dollars.
If the selling spree continues, Bitcoin may have the ability to slice through the $22,660 support level and drop to $20,500.
Despite this grim worst-case scenario, the cryptocurrency market’s unpredictability means the bullish outlook is not out of the question.
The IOMAP model shows that Bitcoin faces little to no resistance in the future. The only considerable supply wall sits at $23,500, where roughly 300,000 addresses obtain over 90,000 BTC.
In light of that fact, it may not take enormous buying pressure to invalidate the pessimistic outlook and lead to new all-time highs.
Ethereum Poised to Jump to $800
Ethereum entered a downtrend over the past five days, which has caused its price to drop by more than 12%. ETH recently went from trading at a new yearly high of $678 to a low of $585.
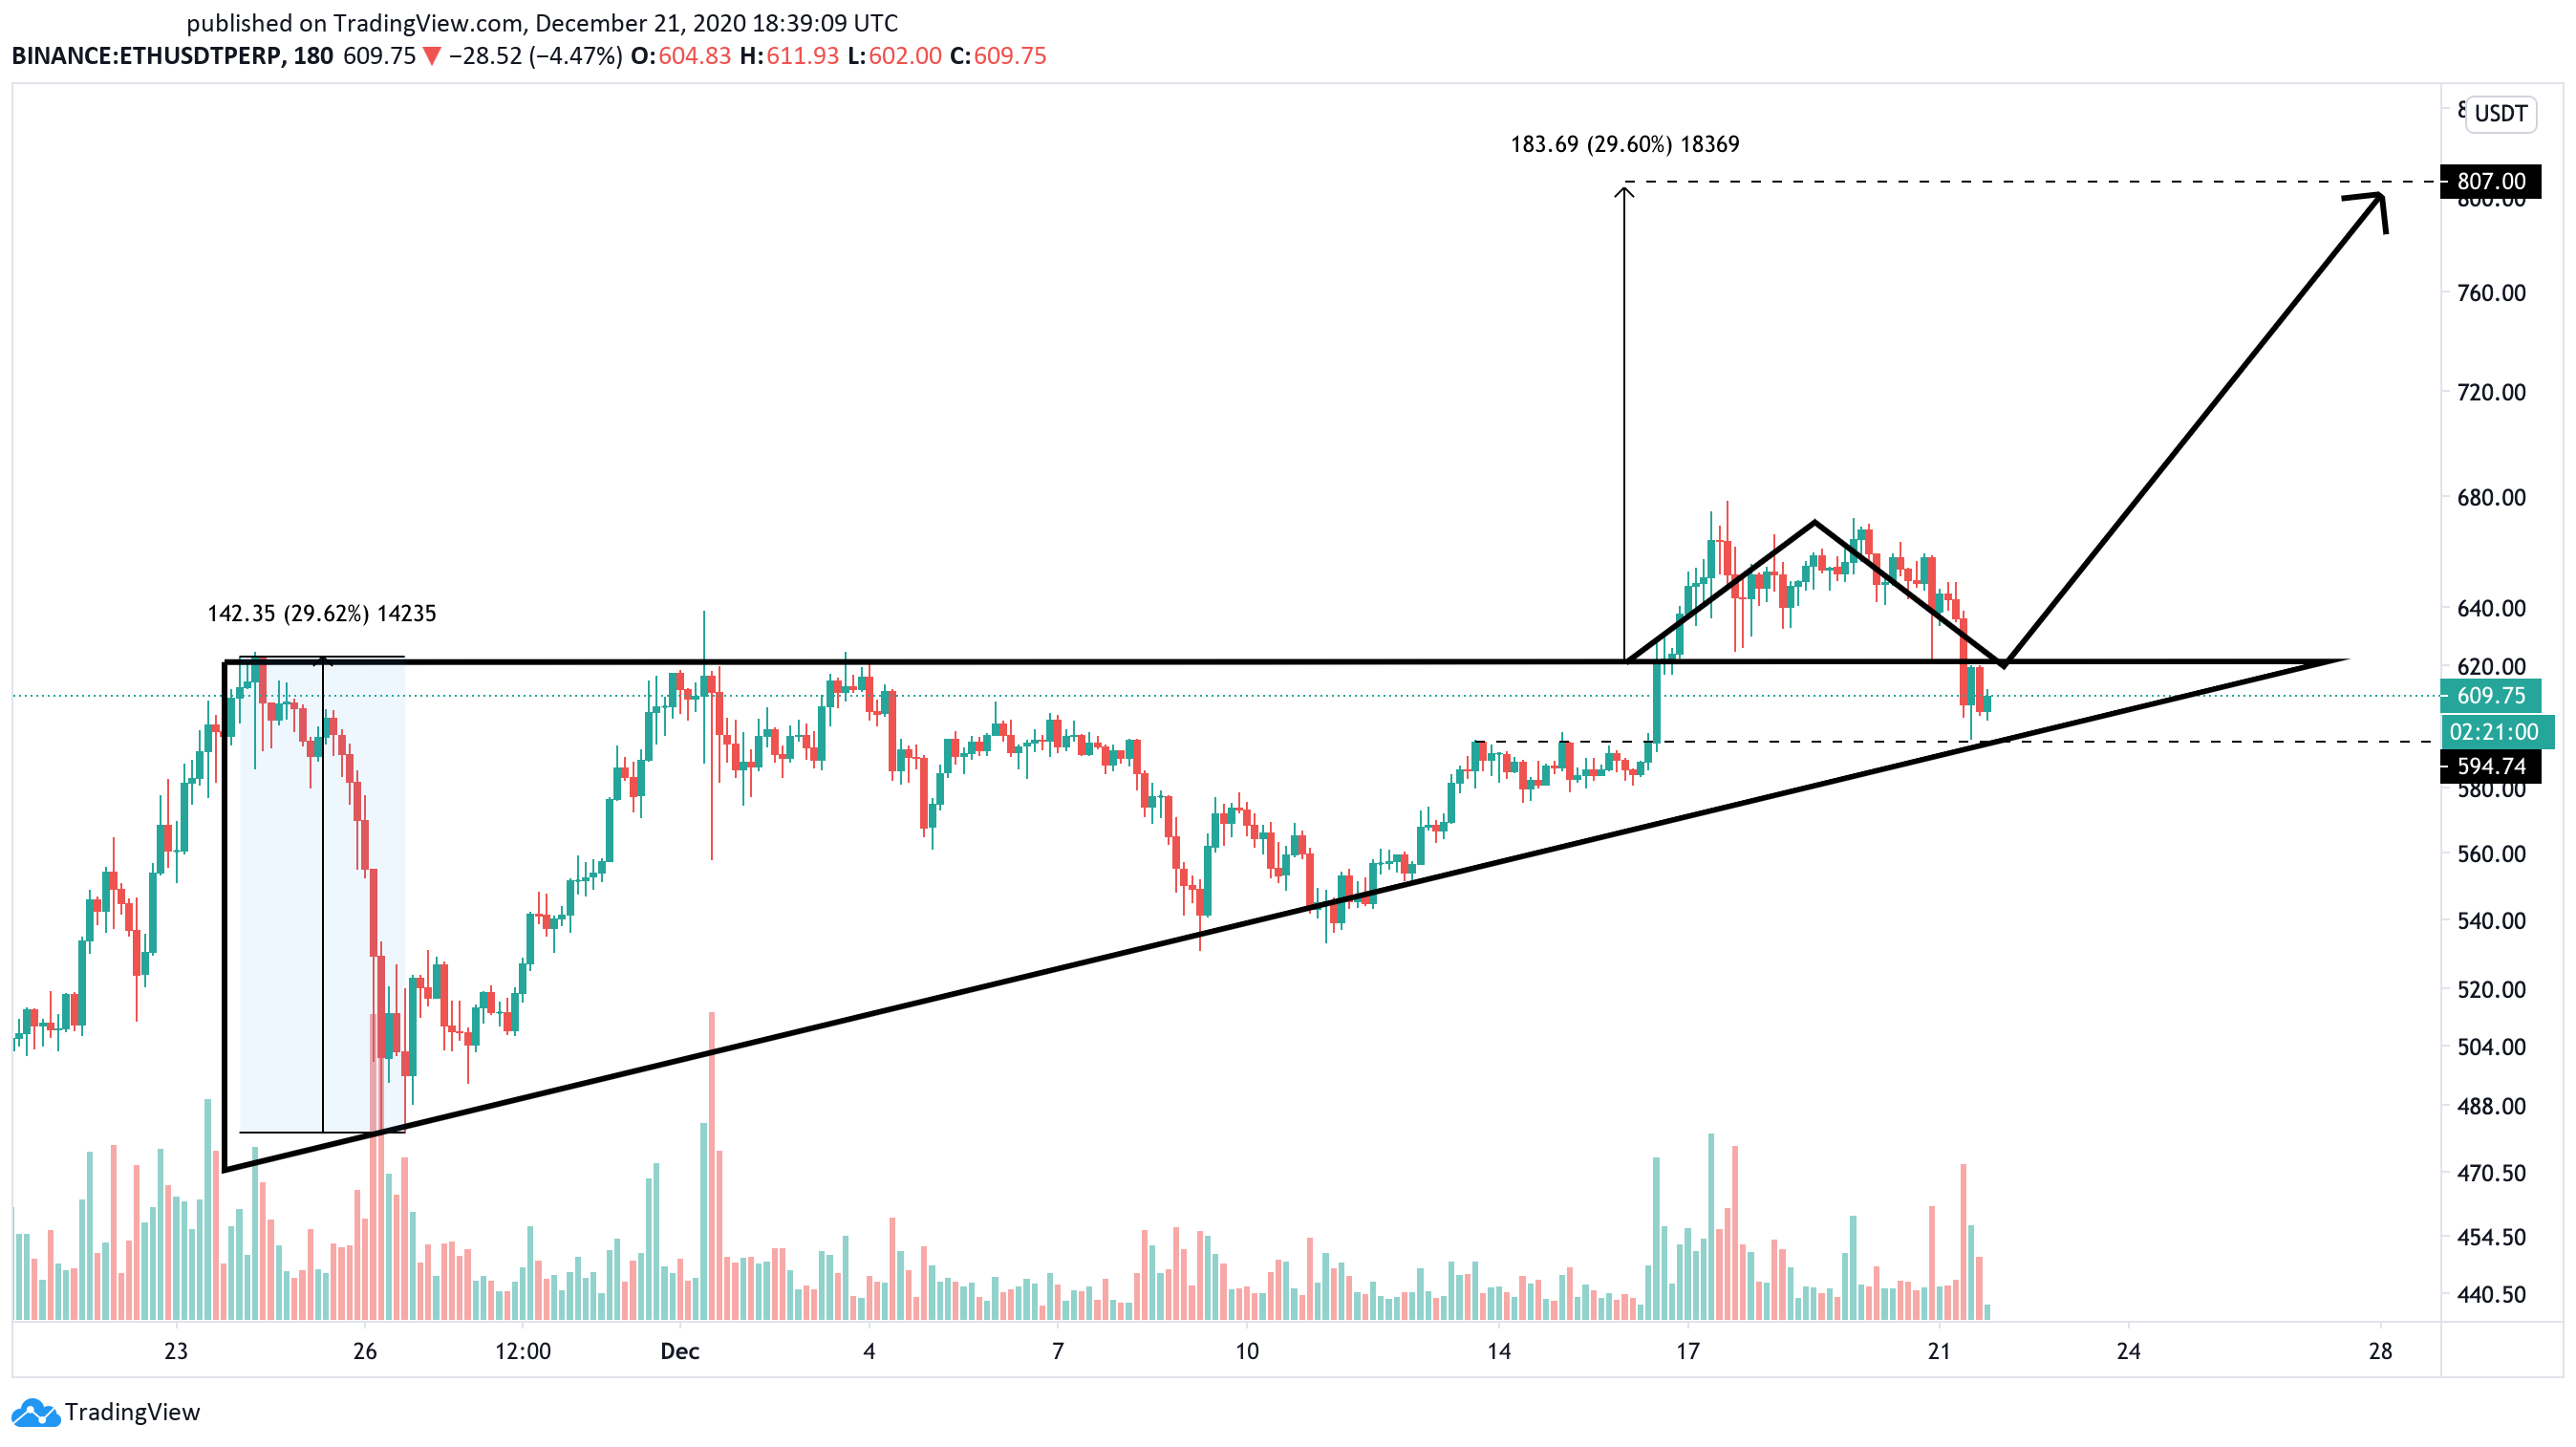
Despite the significant losses incurred in such a short period, ETH looks primed for higher highs. The development of an ascending triangle on ETH’s 3-hour chart suggests that a spike in buying pressure around the current price levels could see Ethereum revisit its recent highs and advance further.
Indeed, Ethereum prices could rise nearly 30% upon breaking the $620 resistance barrier. This target is determined by measuring the distance between the triangle’s two highest points and adding it to the breakout point.

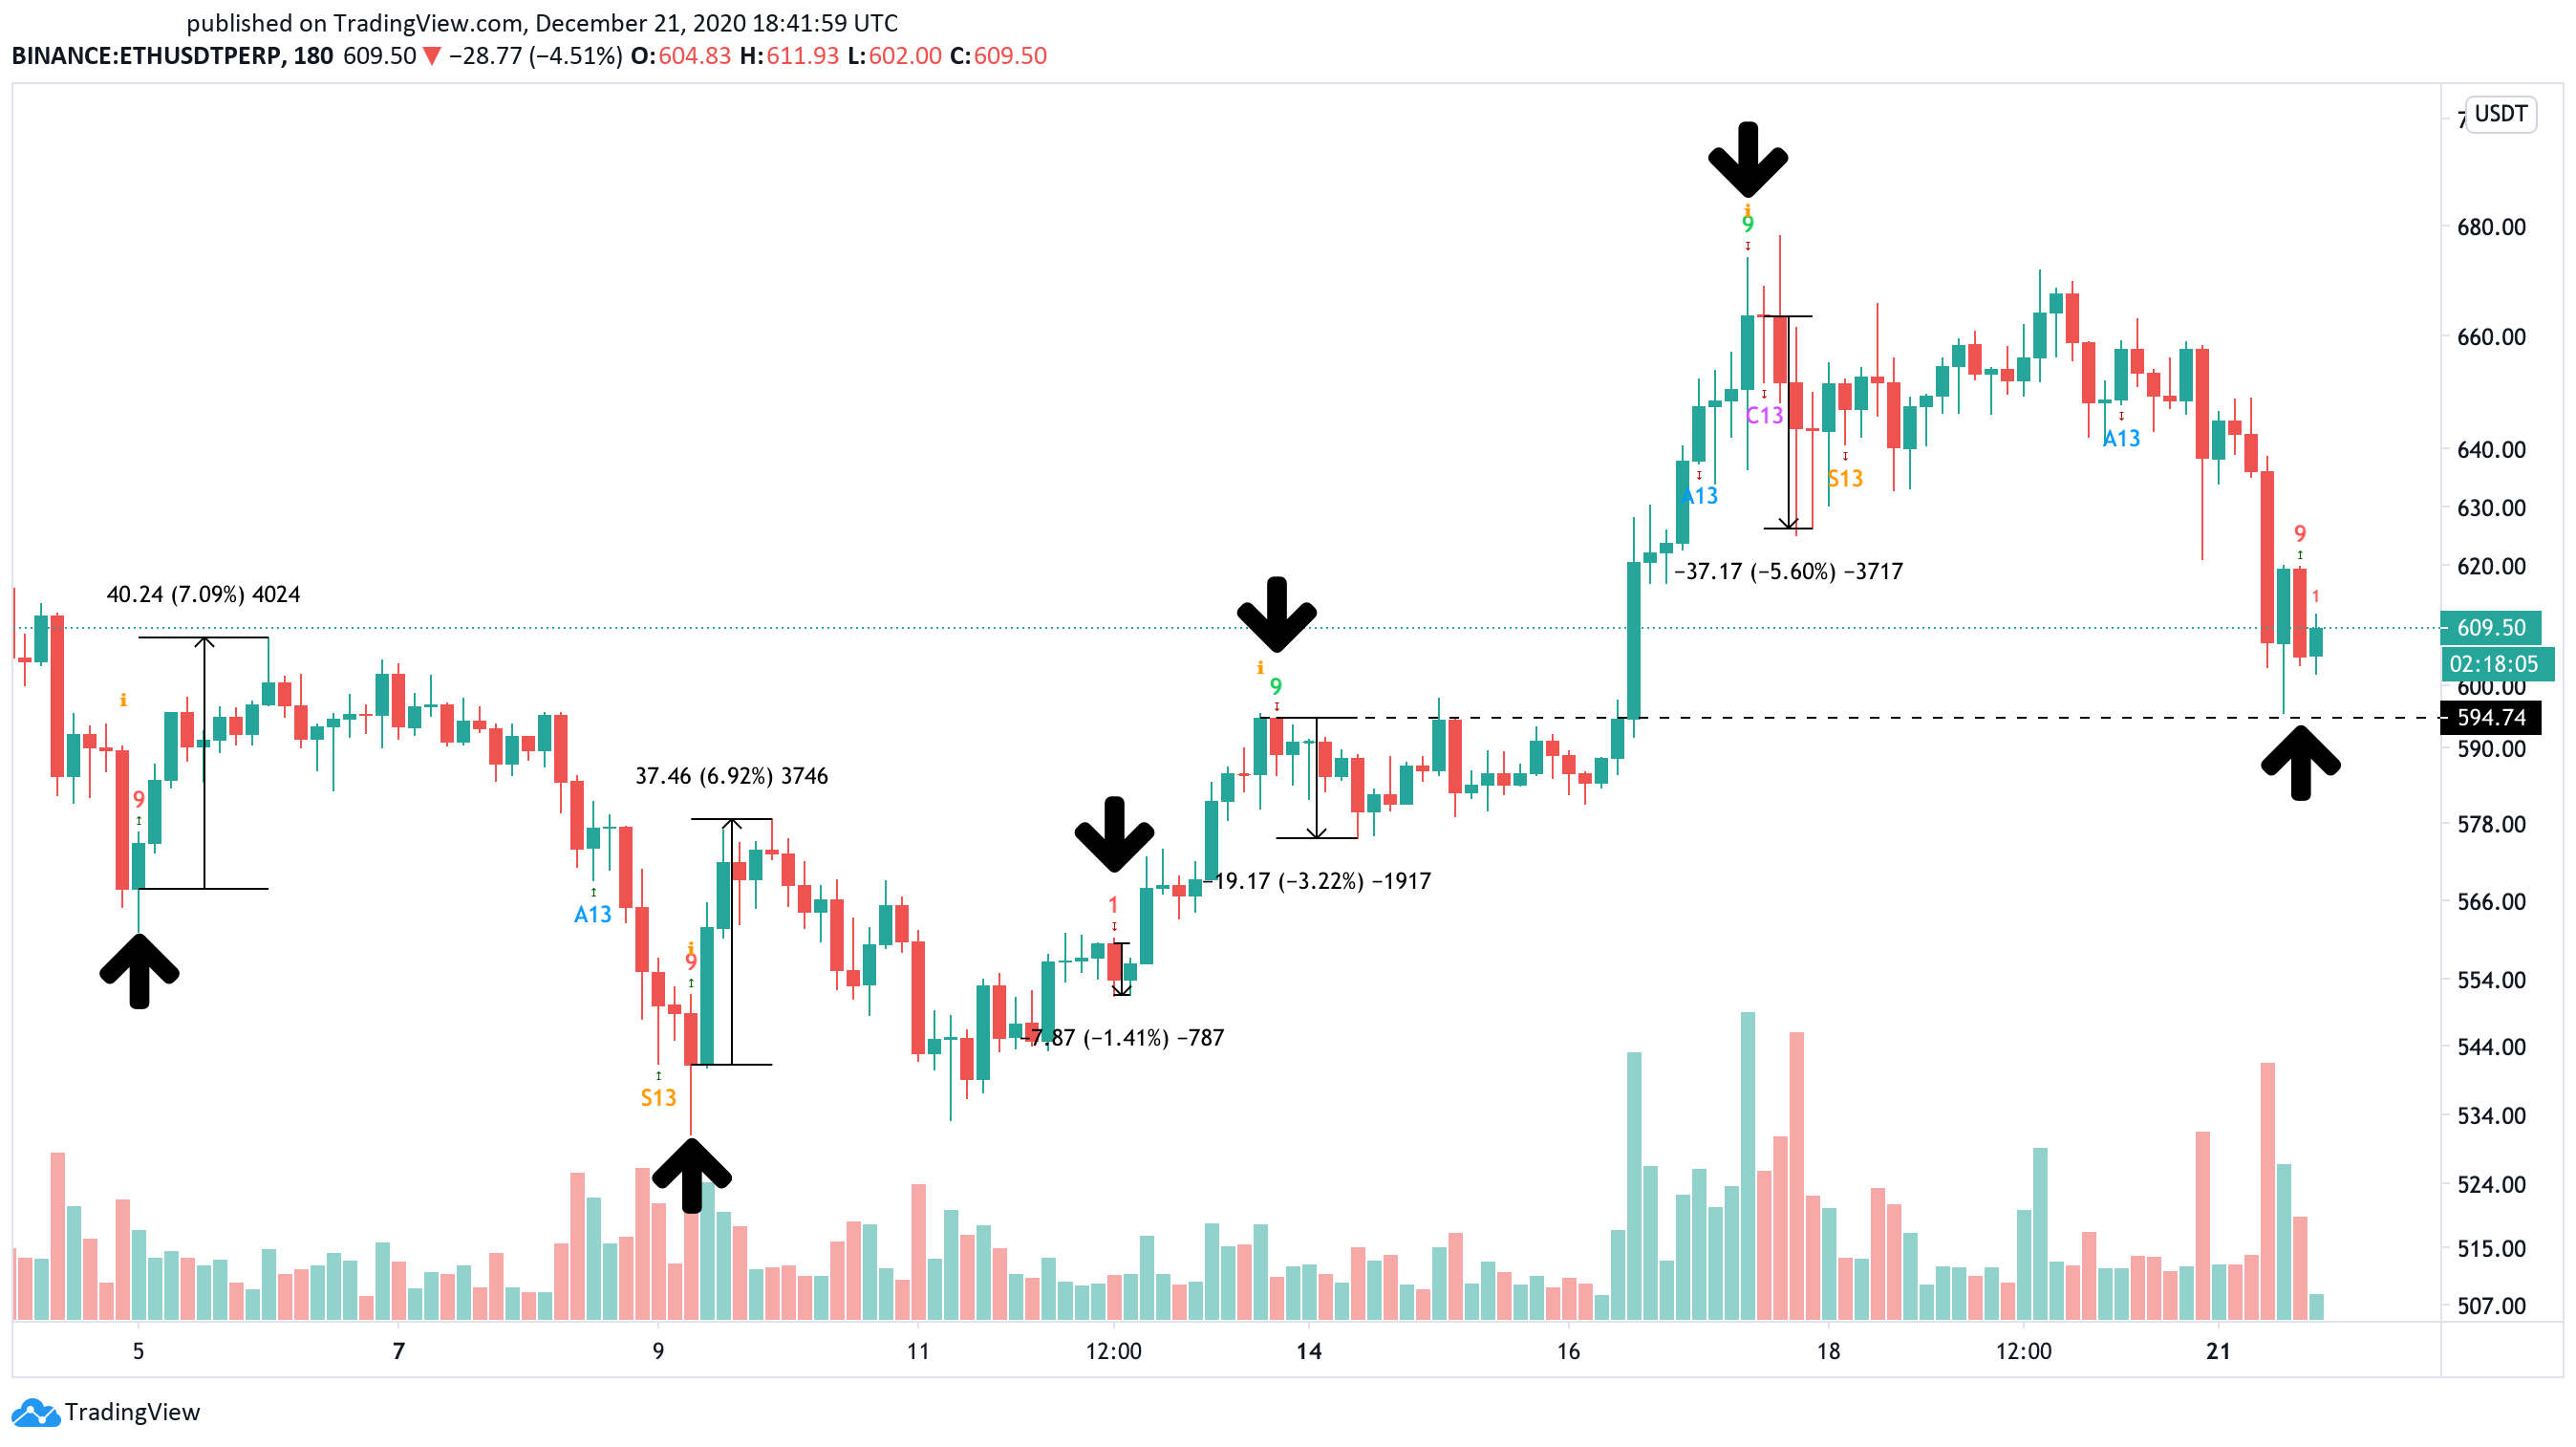
The TD Sequential indicator suggests that Ethereum is bound for new yearly highs. This technical index presented a buy signal in the form of a green nine candlestick within the same time frame.
If validated, ETH prices could rise for up to four 3-hour candlesticks or begin a new upward countdown.

A glimpse at Ethereum’s 3-hour chart reveals that the TD setup has accurately anticipated local tops and bottoms on this altcoin’s trend. The buy and sell signals this indicator presented since early December were all validated, resulting in significant price movements.
Thus, the current optimistic forecast will likely be validated regardless of the “extreme” levels of greed among market participants.
The Cryptocurrency Market Moves Forward
Bitcoin has recently touched all-time highs and produced largely bullish sentiment among investors.
That has led some of the most prominent analysts in the industry to suggest that it is time to realize profits. For instance, trading veteran Peter Brandt publicly stated that he exited 20% of his Bitcoin position because bull rallies are often accompanied by “short-term blow-offs.”
While multiple bearish signals are popping up on the higher time frames, it seems that Bitcoin and Ethereum’s fate will be determined by two demand barriers. Bitcoin bulls must prevent prices from falling below $22,660 to avoid further losses. Meanwhile, Ethereum will likely take a significant nosedive if the $595 support fails to hold.
As long as these price hurdles continue to hold, the uptrend will remain intact, and the top two cryptocurrencies by market capitalization will aim for higher highs.
Disclosure: At time of writing, this author owned Bitcoin and Ethereum.
