Bitcoin, Ethereum Set Up for Potential Rebound
The top two cryptocurrencies look primed to bounce back after finding support.

Key Takeaways
- Bitcoin and Ethereum dropped by over 10% in the last three days.
- Both cryptocurrencies now present buy signals on their four-hour charts.
- A spike in buying pressure could push BTC to $21,500 and ETH to $1,200.
Share this article
Bitcoin and Ethereum appear to be trading in oversold territory after incurring more than 10% losses over the past three days.
Bitcoin and Ethereum Present Buy Signals
Bitcoin and Ethereum kicked off Monday in a negative posture, but momentum may be building for a significant rebound.
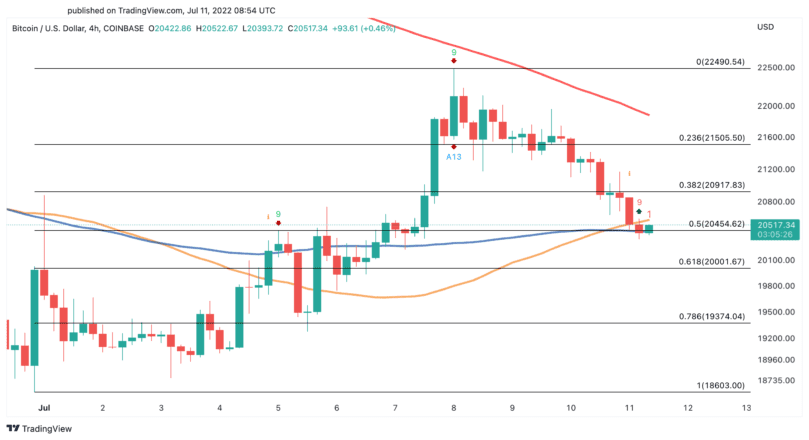
The flagship cryptocurrency has retraced nearly 10% after getting rejected by its 200-hour moving average on the four-hour chart. It went from trading at a high of $22,490 on Jul. 8 to touching a low of $20,350 early Monday morning. Bitcoin’s 100-hour moving average is now acting as stable support, which could prevent it from dipping further.
The formation of a buy signal per the Tom DeMark (TD) Sequential indicator supports this optimistic outlook. The bullish formation developed as a red nine candlestick, which is indicative of a one to four candlestick upswing. If Bitcoin can hold above $20,450, it could gain the strength to rebound toward $20,900 or even $21,500.
Likewise, Ethereum also appears to be trading in oversold territory after experiencing an 11% correction in the same period. The second-largest cryptocurrency by market capitalization has seen its price drop from $1,275 to $1,135 within the last three days. However, like Bitcoin, there are some signs suggesting that a rebound is underway.
The TD Sequential also presented a buy signal in the form of a red nine candlestick on ETH’s four-hour chart. A sustained candlestick close above $1,160 could help validate this bullish formation. If this were to happen, Ethereum could surge toward its 200-hour moving average at around $1,200.
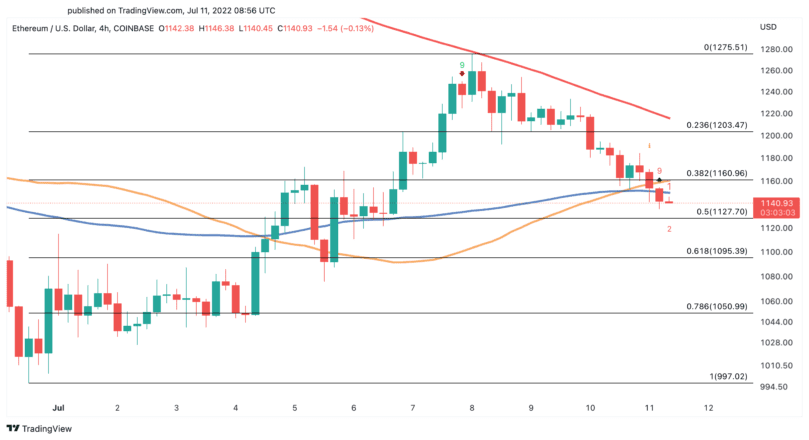
Although the odds currently appear to favor the bulls, monitoring the price of Bitcoin and Ethereum as trading volumes continue trending down is imperative. A breach of BTC’s $20,450 support level could trigger a downswing to $20,000 or $19,375 for the top cryptocurrency. Meanwhile, ETH could drop to $1,050 if it losses $1,127 as support.
Disclosure: At the time of writing, the author of this piece owned BTC and ETH.
Share this article
