
Bitcoin Prepares to Break $11,000 Resistance, Ethereum Ready to Fall
Pressure builds behind Bitcoin as it finally prepares to break above $11,000. Ethereum, meanwhile, is in a precarious position and looks ready to tumble.
Bitcoin looks ready to advance past $11,000 after a week of consolidation. Ethereum is projected to start falling again despite 10 days of slowly climbing prices.
Bitcoin Ready for a Further Advance
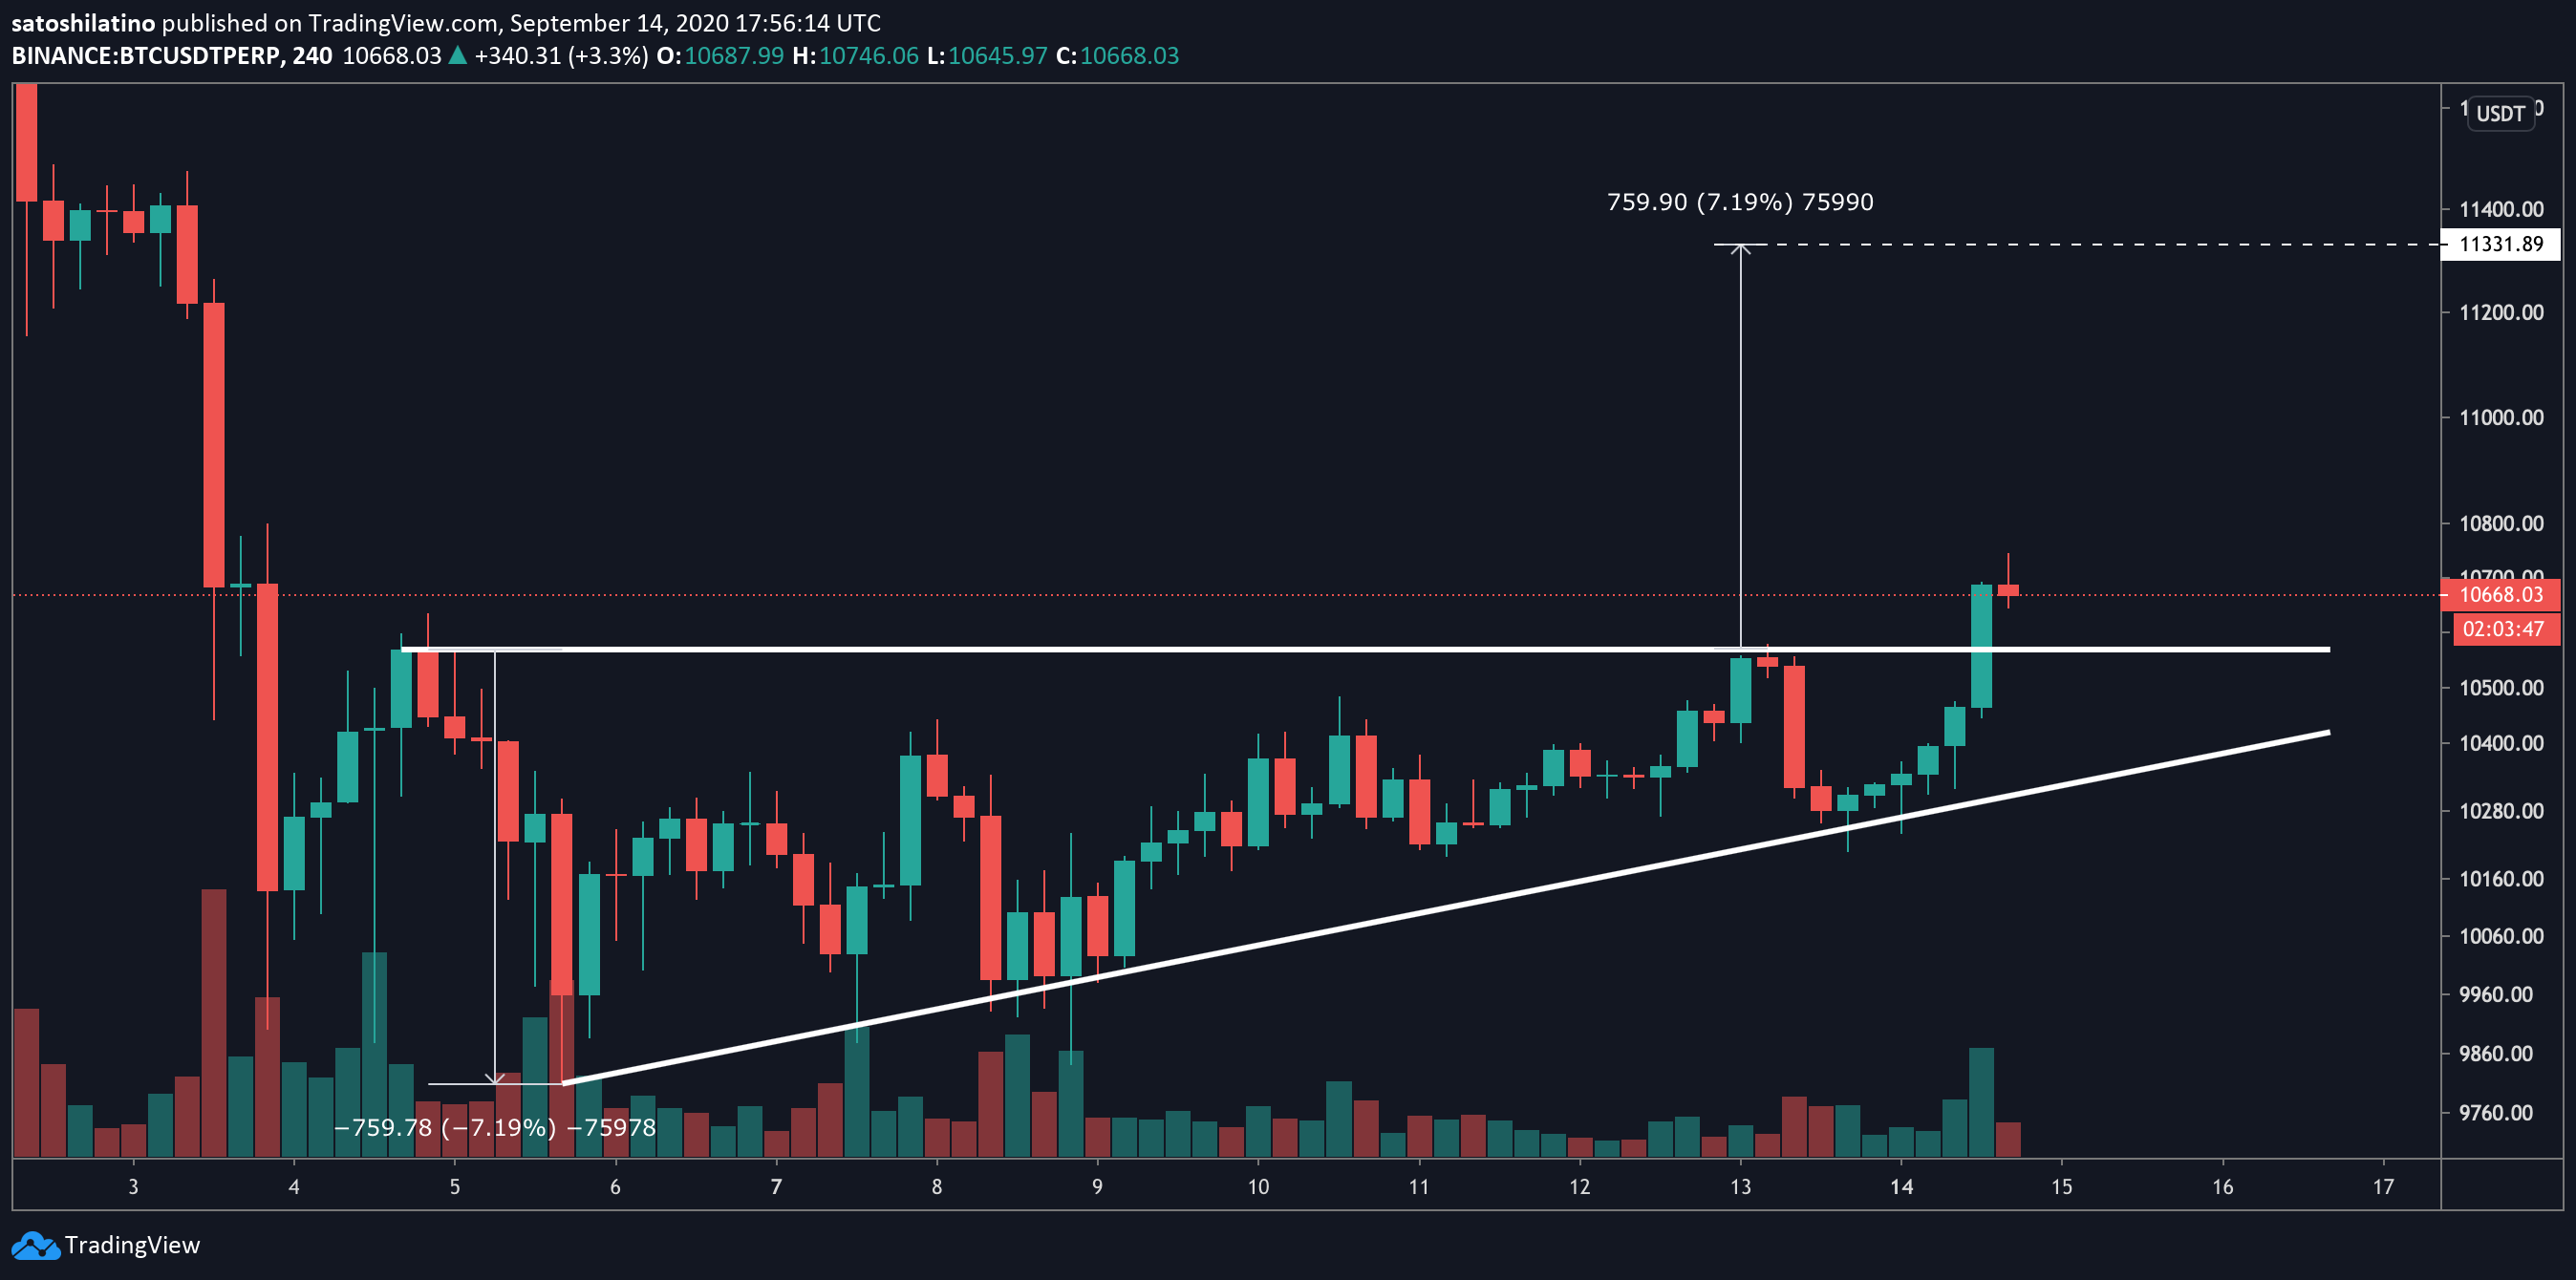
Bitcoin consolidated within a narrow range over the past week, which followed its 19% drop at the beginning of September. On BTC’s 4-hour chart, prices are contained within an ascending triangle. A rising trendline is developing along with the swing-lows while a horizontal line formed along the swing-highs.
Bitcoin tried to break out of this technical pattern on Sept. 13, but it quickly reversed to retest the channel’s boundaries at the triangle’s hypotenuse. A spike in demand around this support level looks strong enough to allow BTC to bust through resistance, allowing it to advance beyond the $11,000 mark.
By measuring the triangle’s highest points and adding that to the breakout’s distance, the technical pattern suggests that BTC is poised to rise as much as 7%. In the best-case scenario under that assumption, a bullish impulse that breaks resistance could send prices as high as $11,330.
One indicator from analytics firm IntoTheBlock affirms the bullish outlook. The “In/Out of the Money Around” (IOMAP) price model shows cohorts of buyers and what they paid to acquire their coins, which gives a good approximation of the average purchase price for different segments of Bitcoin holders. Based on this on-chain metric, there aren’t significant supply barriers ahead that would obstruct the rise to $11,300.
However, a further advance could be difficult; around the $11,300 mark, 1.3 million addresses purchased over 930,000 BTC. These holders are more inclined to exit their currently underwater positions as prices rise, keeping an advance at bay.
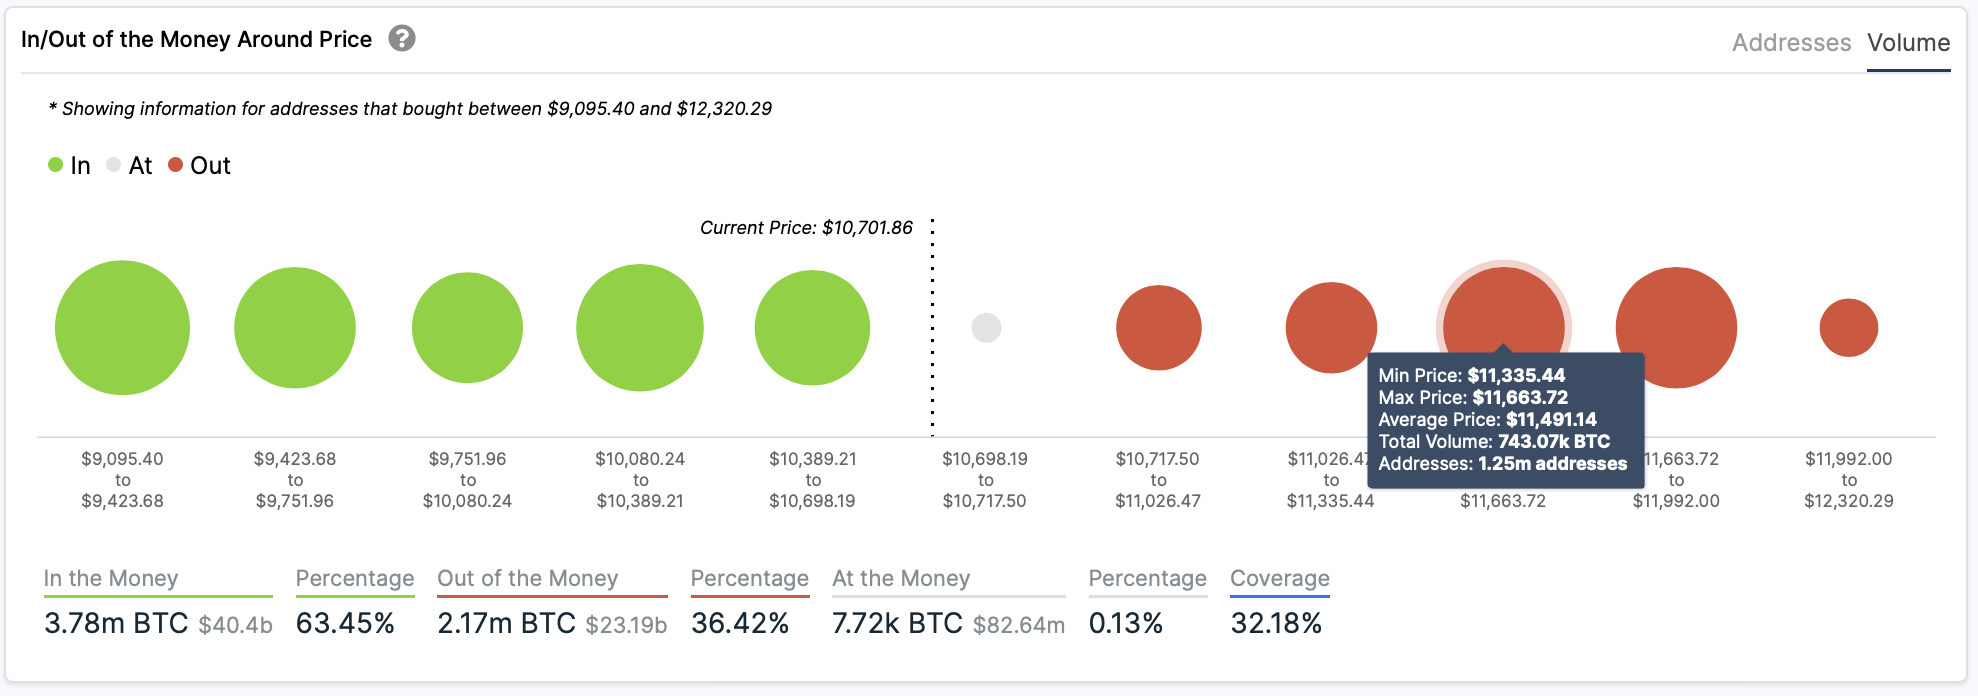
On the support side, the IOMAP cohorts also show strong buy-in for Bitcoin around $10,200, which is also where the hypotenuse of the technical pattern mentioned above sits. Roughly 1.8 million addresses bought 840,000 BTC around this price level. The convergence of these two barriers should sustain prices above the $10,000 mark.
Ethereum Prices Prepared to Fall?
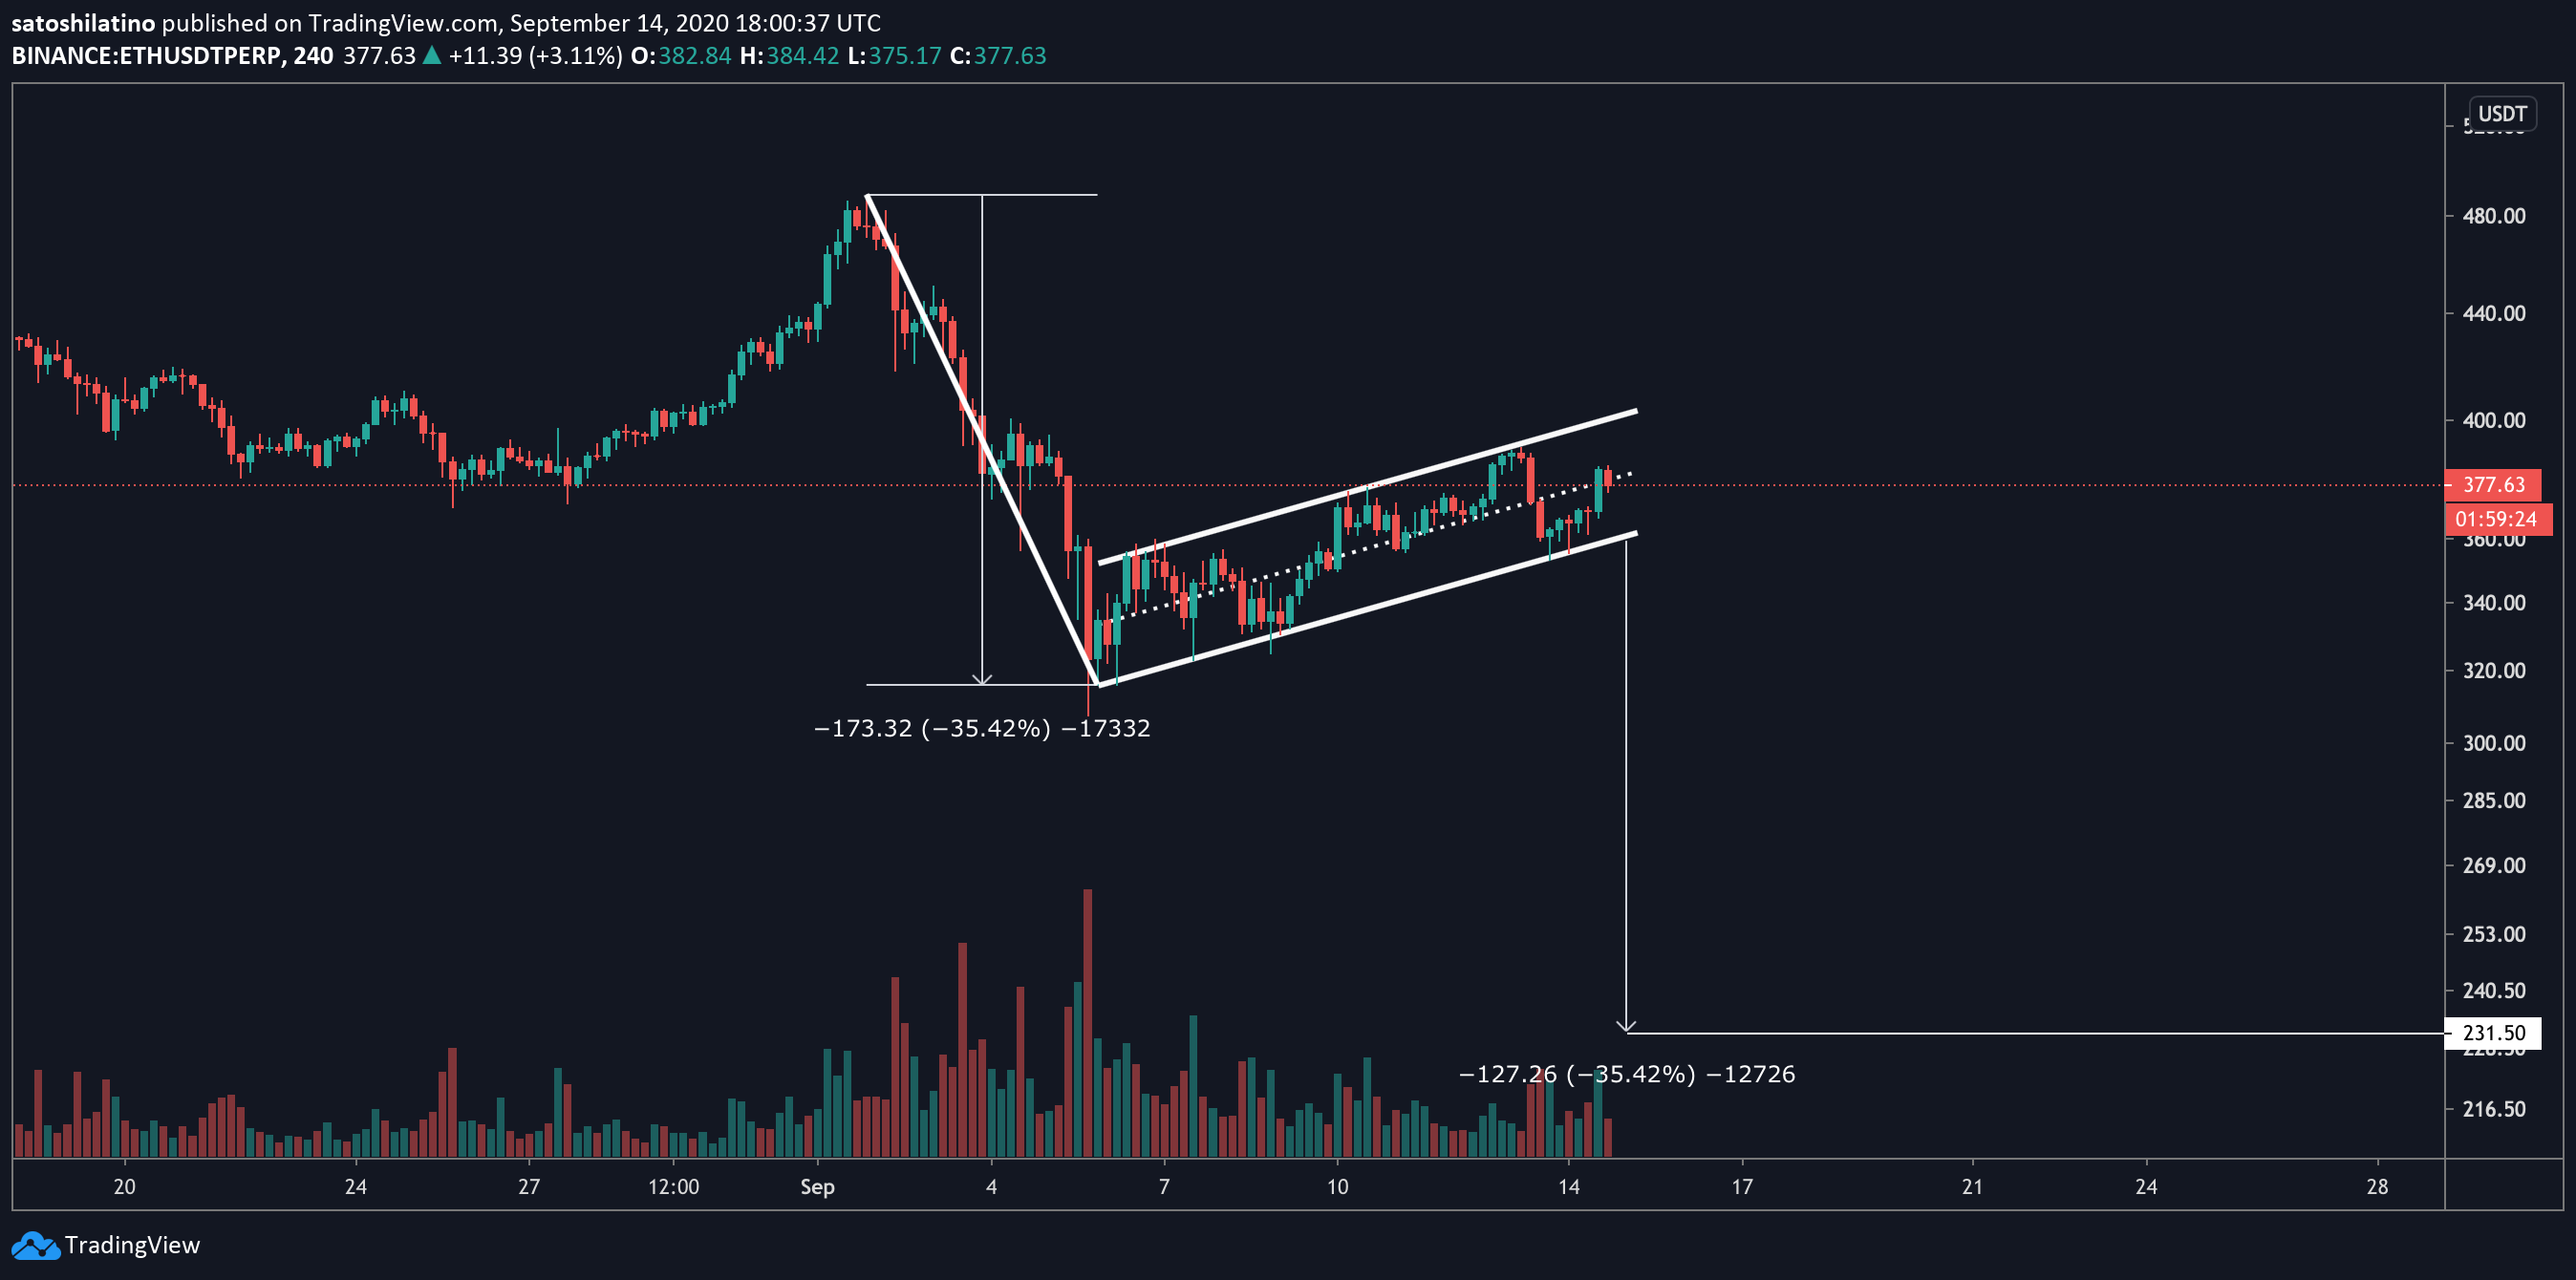
Unlike Bitcoin, Ethereum looks bearish on its 4-hour chart. The 35% downswing between the Sept. 1-5 created a flag pattern predicting falling prices.
Usually, this technical pattern suggests that the asset’s trend will continue in the same direction as the initial movement—in this case, down. Based on the size of the pattern and the height of the flagpole, it predicts a target as much as 35% to the downside, which could see the smart contract leader plunge to $230.
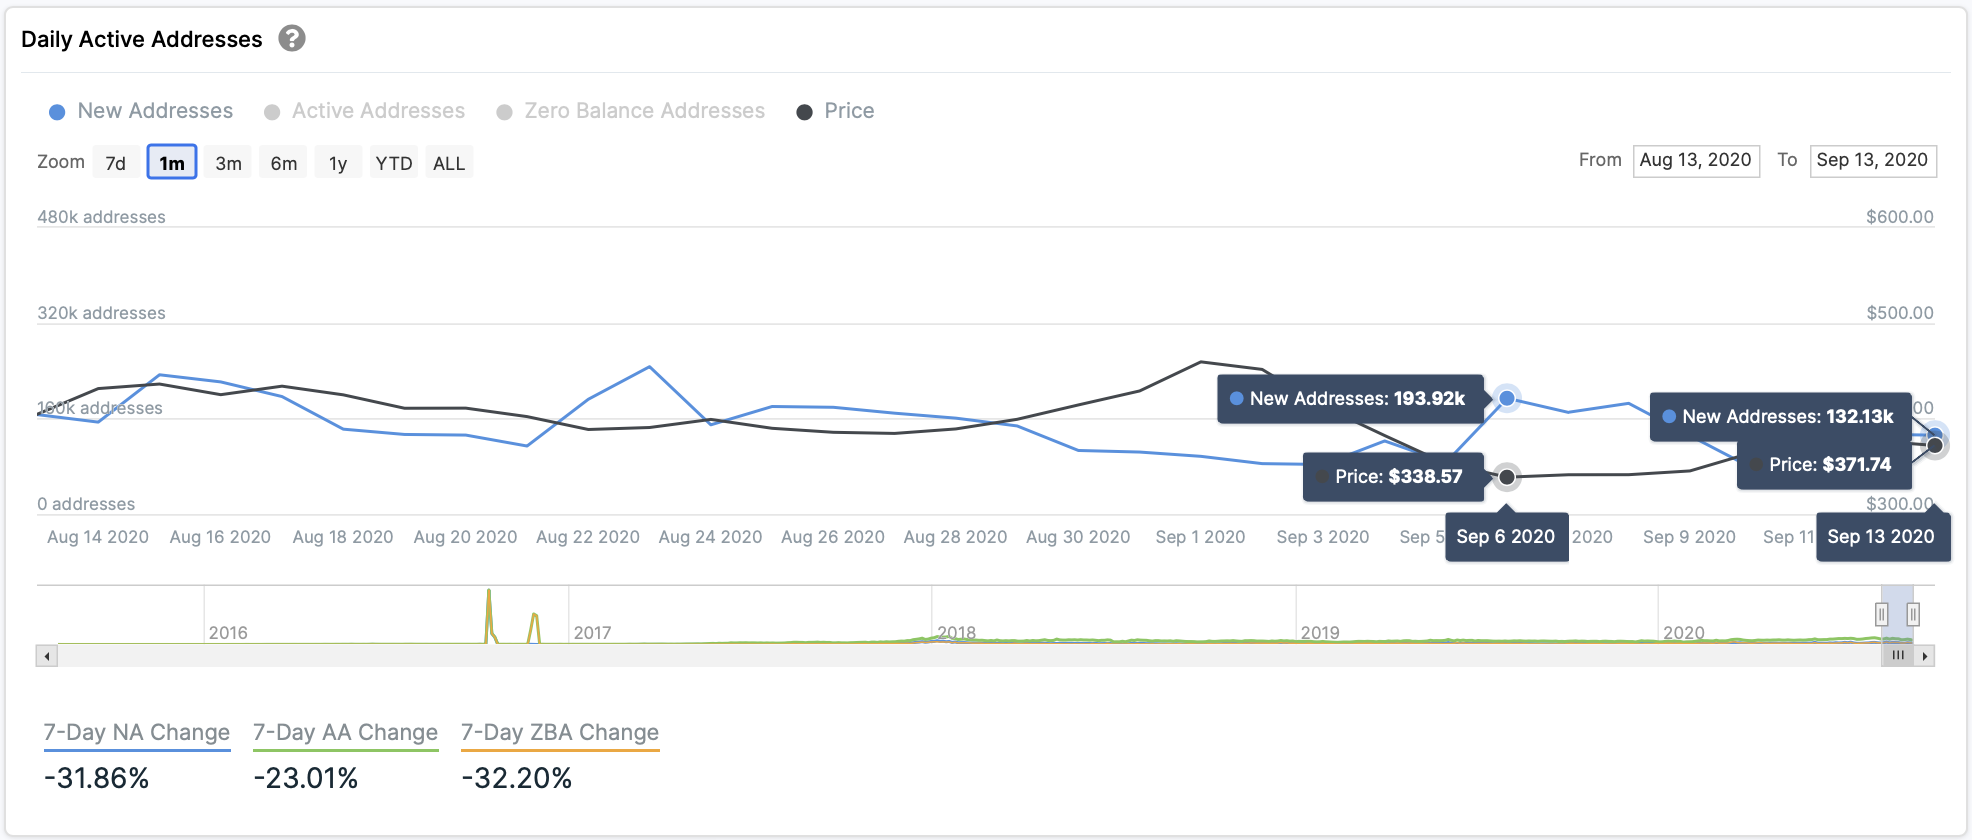
The downward trend in network growth adds credence to the bearish outlook. Brian Quinlivan, marketing and social media director at Santiment, maintains that network growth is “one of the most accurate price foreshadowers.” As such, investors should be wary of Ethereum’s weak adoption metrics as of late.
“Generally, a rising network growth leads to a rising price of any project over time, in most cases. On the flip side, declining network growth for a long enough stretch can usually indicate a future slumping price with the lack of newly created addresses constantly in-flowing the coin or token,” said Quinlivan.
In the event of a correction, IOMAP cohorts again reveal a formidable supply wall underneath Ethereum between $367 and $377. Here, roughly 480,000 addresses purchase over 9 million Ether.
This is an intense area of interest for investors. It should keep falling prices at bay—but if it breaks, it could be catastrophic for prices, in line with the pessimistic prediction from the flag pattern mentioned earlier.
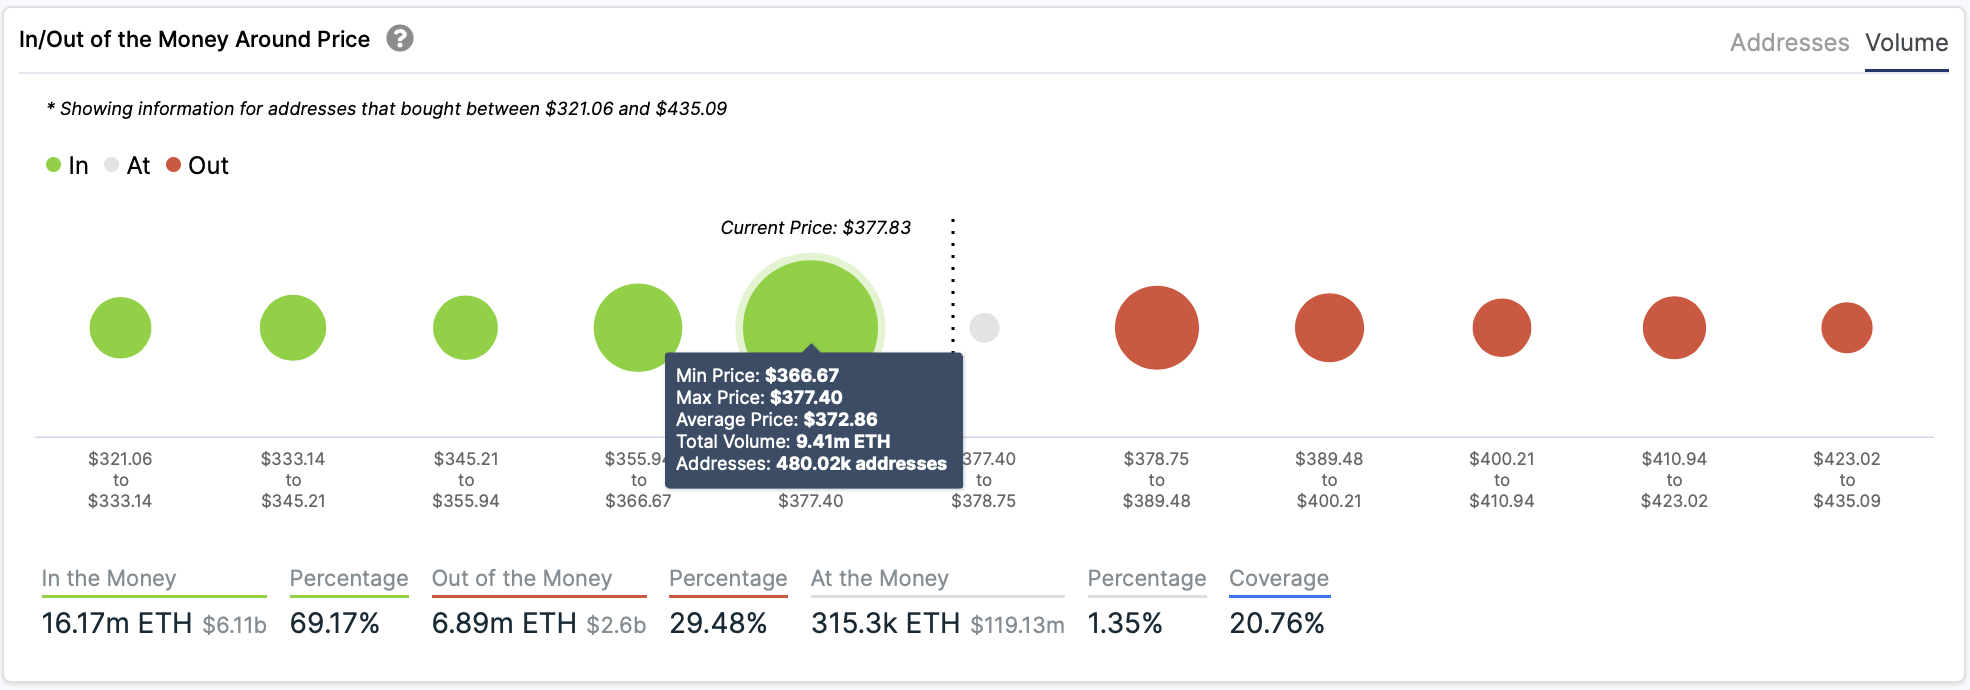
But there’s good news as well. The IOMAP cohorts show that Ethereum faces almost no price resistance ahead. Nearly 1 million addresses hold 2.6 million ETH priced between $380 and $390. Given the large number of addresses holding relatively little Ether, it shows that bulls won’t struggle to push prices further up. A spike in buying pressure would allow Ethereum to resume its impressive uptrend.
Crypto Market Uncertainty Rises
Investors remain fearful of a further downturn in the cryptocurrency market. Bitcoin’s CME gap at $9,615 continues to hunt those who are betting to the upside. Even trading veteran Peter Brandt has spoken about the reality that BTC could dive below $9,000 and Ethereum could drop to $250.
As uncertainty continues to grow, it is imperative to wait for a clear break of the different support and resistance points before entering a position. Breaking through resistance could signal the bull market’s continuation while cracking support will represent an excellent opportunity for sidelined investors to get back into the market. Only time will tell which scenario will take place first.
