BitcoinSV / USD Technical Analysis: Waiting For The Breakout

Share this article
- BitcoinSV is trading within a descending price channel in the short-term
- Medium-term BSV / USD bulls are attempting to break above the pair’s 5-day moving average for the first time in nearly four-weeks
- A bullish channel breakout would likely trigger technical buying towards the 80.0000 region.
BitcoinSV / USD Short-term price analysis
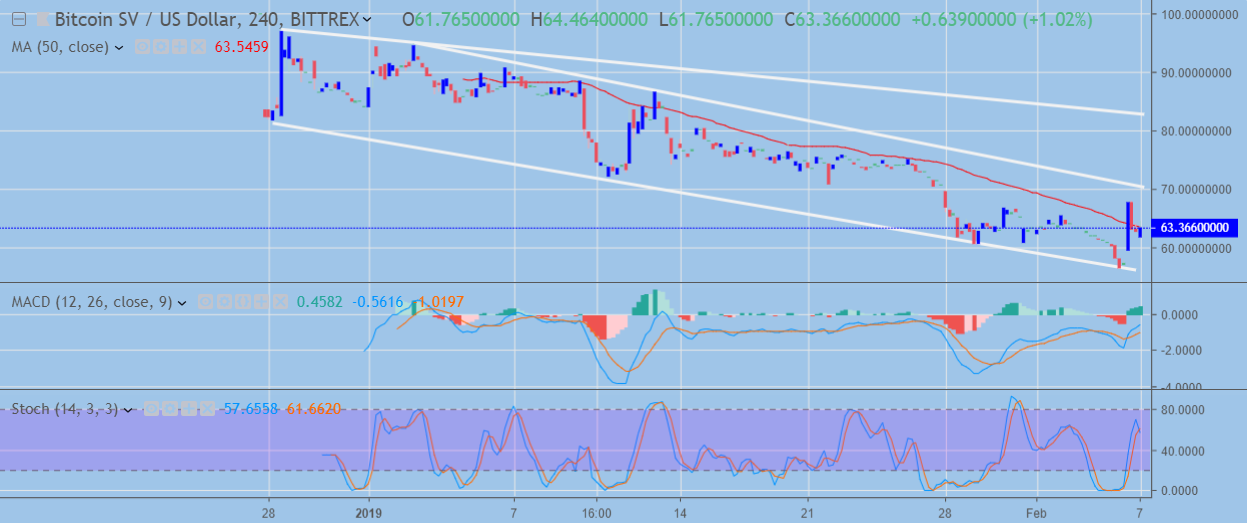
In the short-term the BSV / USD pair remains bearish as price remains trapped within a descending price channel. Buyers are currently attempting to move price above the middle of the channel after sellers once again failed to breach the channel bottom.
A confirmed technical breakout from the channel would likely spark a wave of technical buying towards the 80.0000 region.
In the short-term, traders are likely to scalp the range inside the channel, until a clear technical breakout occurs.
Pattern Watch
Aside from the channel, price is creating bearish lower highs and lower lows so the overall direction of trade remains to the downside.

BSV / USD H4 Chart (Source: TradingView)
Stochastic Indicator
The Stochastic Indicator on the four-hour time frame remains bullish and has yet to cross lower despite the apparent pullback in price.
MACD Indicator
The MACD indicator on the mentioned time frame remains bullish and has further scope to trade higher.
BitcoinSV / USD Medium-term price analysis
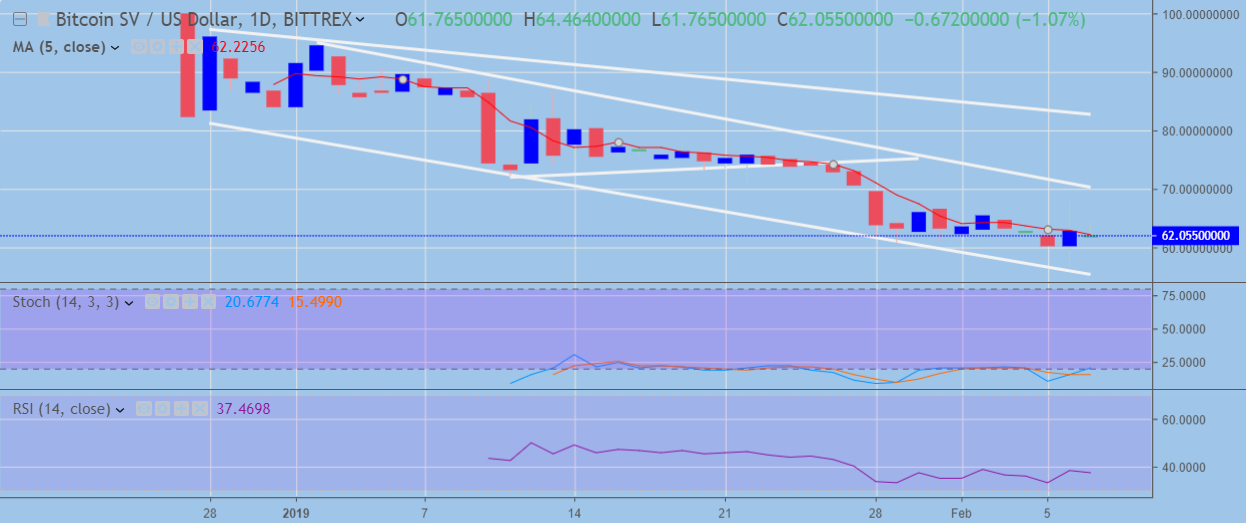
BitcoinSV is bearish across the medium-time frame, with bulls currently testing the pair’s 5-day moving average for the first time in nearly four weeks.
Due to the lack of historical data available for the BitcoinSV pair, the daily time frame chart closely mirrors the four-hour time frame chart.
Interestingly, indicators for the BSV / USD pair on the daily time frame appear oversold with potential for a technical reversal. Price stabilization above the pair’s 5-day moving average could be the first sign that a rally towards the channel-top may occur.
Pattern Watch
Traders should note that the BitcoinSV is making fresh daily, weekly and monthly lows and has showed a pattern of a price consolidation then sharp downward moves.

BSV / USD Daily Chart (Source: TradingView)
RSI Indicator
The Relative Strength Index on the daily time frame has yet to move into extreme oversold conditions. It is worth noting that a bullish inverted head and shoulders pattern maybe taking shape on the RSI.
Stochastic Indicator
The Stochastic Indicator is extremely oversold and is showing promising signs that a bullish move may soon occur.
Conclusion
BitcoinSV is likely to remain bearish in the short and medium-term until a confirmed upside technical breakout for the price channel occurs.
Trading opportunities are likely to present themselves when the BitcoinSV pair trades towards the upper or lower end of the price channel.

Decentral Media, Inc., the publisher of Crypto Briefing, is not an investment advisor and does not offer or provide investment advice or other financial advice. Nothing on this website constitutes, or should be relied on as, investment advice or financial advice of any kind. Specifically, none of the information on this website constitutes, or should be relied on as, a suggestion, offer, or other solicitation to engage in, or refrain from engaging in, any purchase, sale, or any other any investment-related activity with respect to any transaction. You should never make an investment decision on an investment based solely on the information on our website, and you should never interpret or otherwise rely on any of the information on this website as investment advice. We strongly recommend that you consult a licensed investment advisor or other qualified financial professional if you are seeking investment advice on an investment.
