Cardano Enters New Bullish Cycle Towards All-Time Highs
Cardano is back in the green as it aims to catch up with the bullish trend seen across the entire cryptocurrency market.

Key Takeaways
- Cardano saw its price plunge by 42% after reaching a nearly three-year high of $0.39.
- The downswing presented an opportunity for investors to “buy the dip,” which allowed ADA to rebound quickly.
- If buying pressure continues mounting, this altcoin could rise by more than 900%.
Share this article
The sixth-largest cryptocurrency by market cap, Cardano, has gained the buying pressure needed to resume its bull run following a steep correction. Now that sidelined investors have re-entered the market, ADA looks primed for new all-time highs.
Cardano Prime for a Massive Bull Run
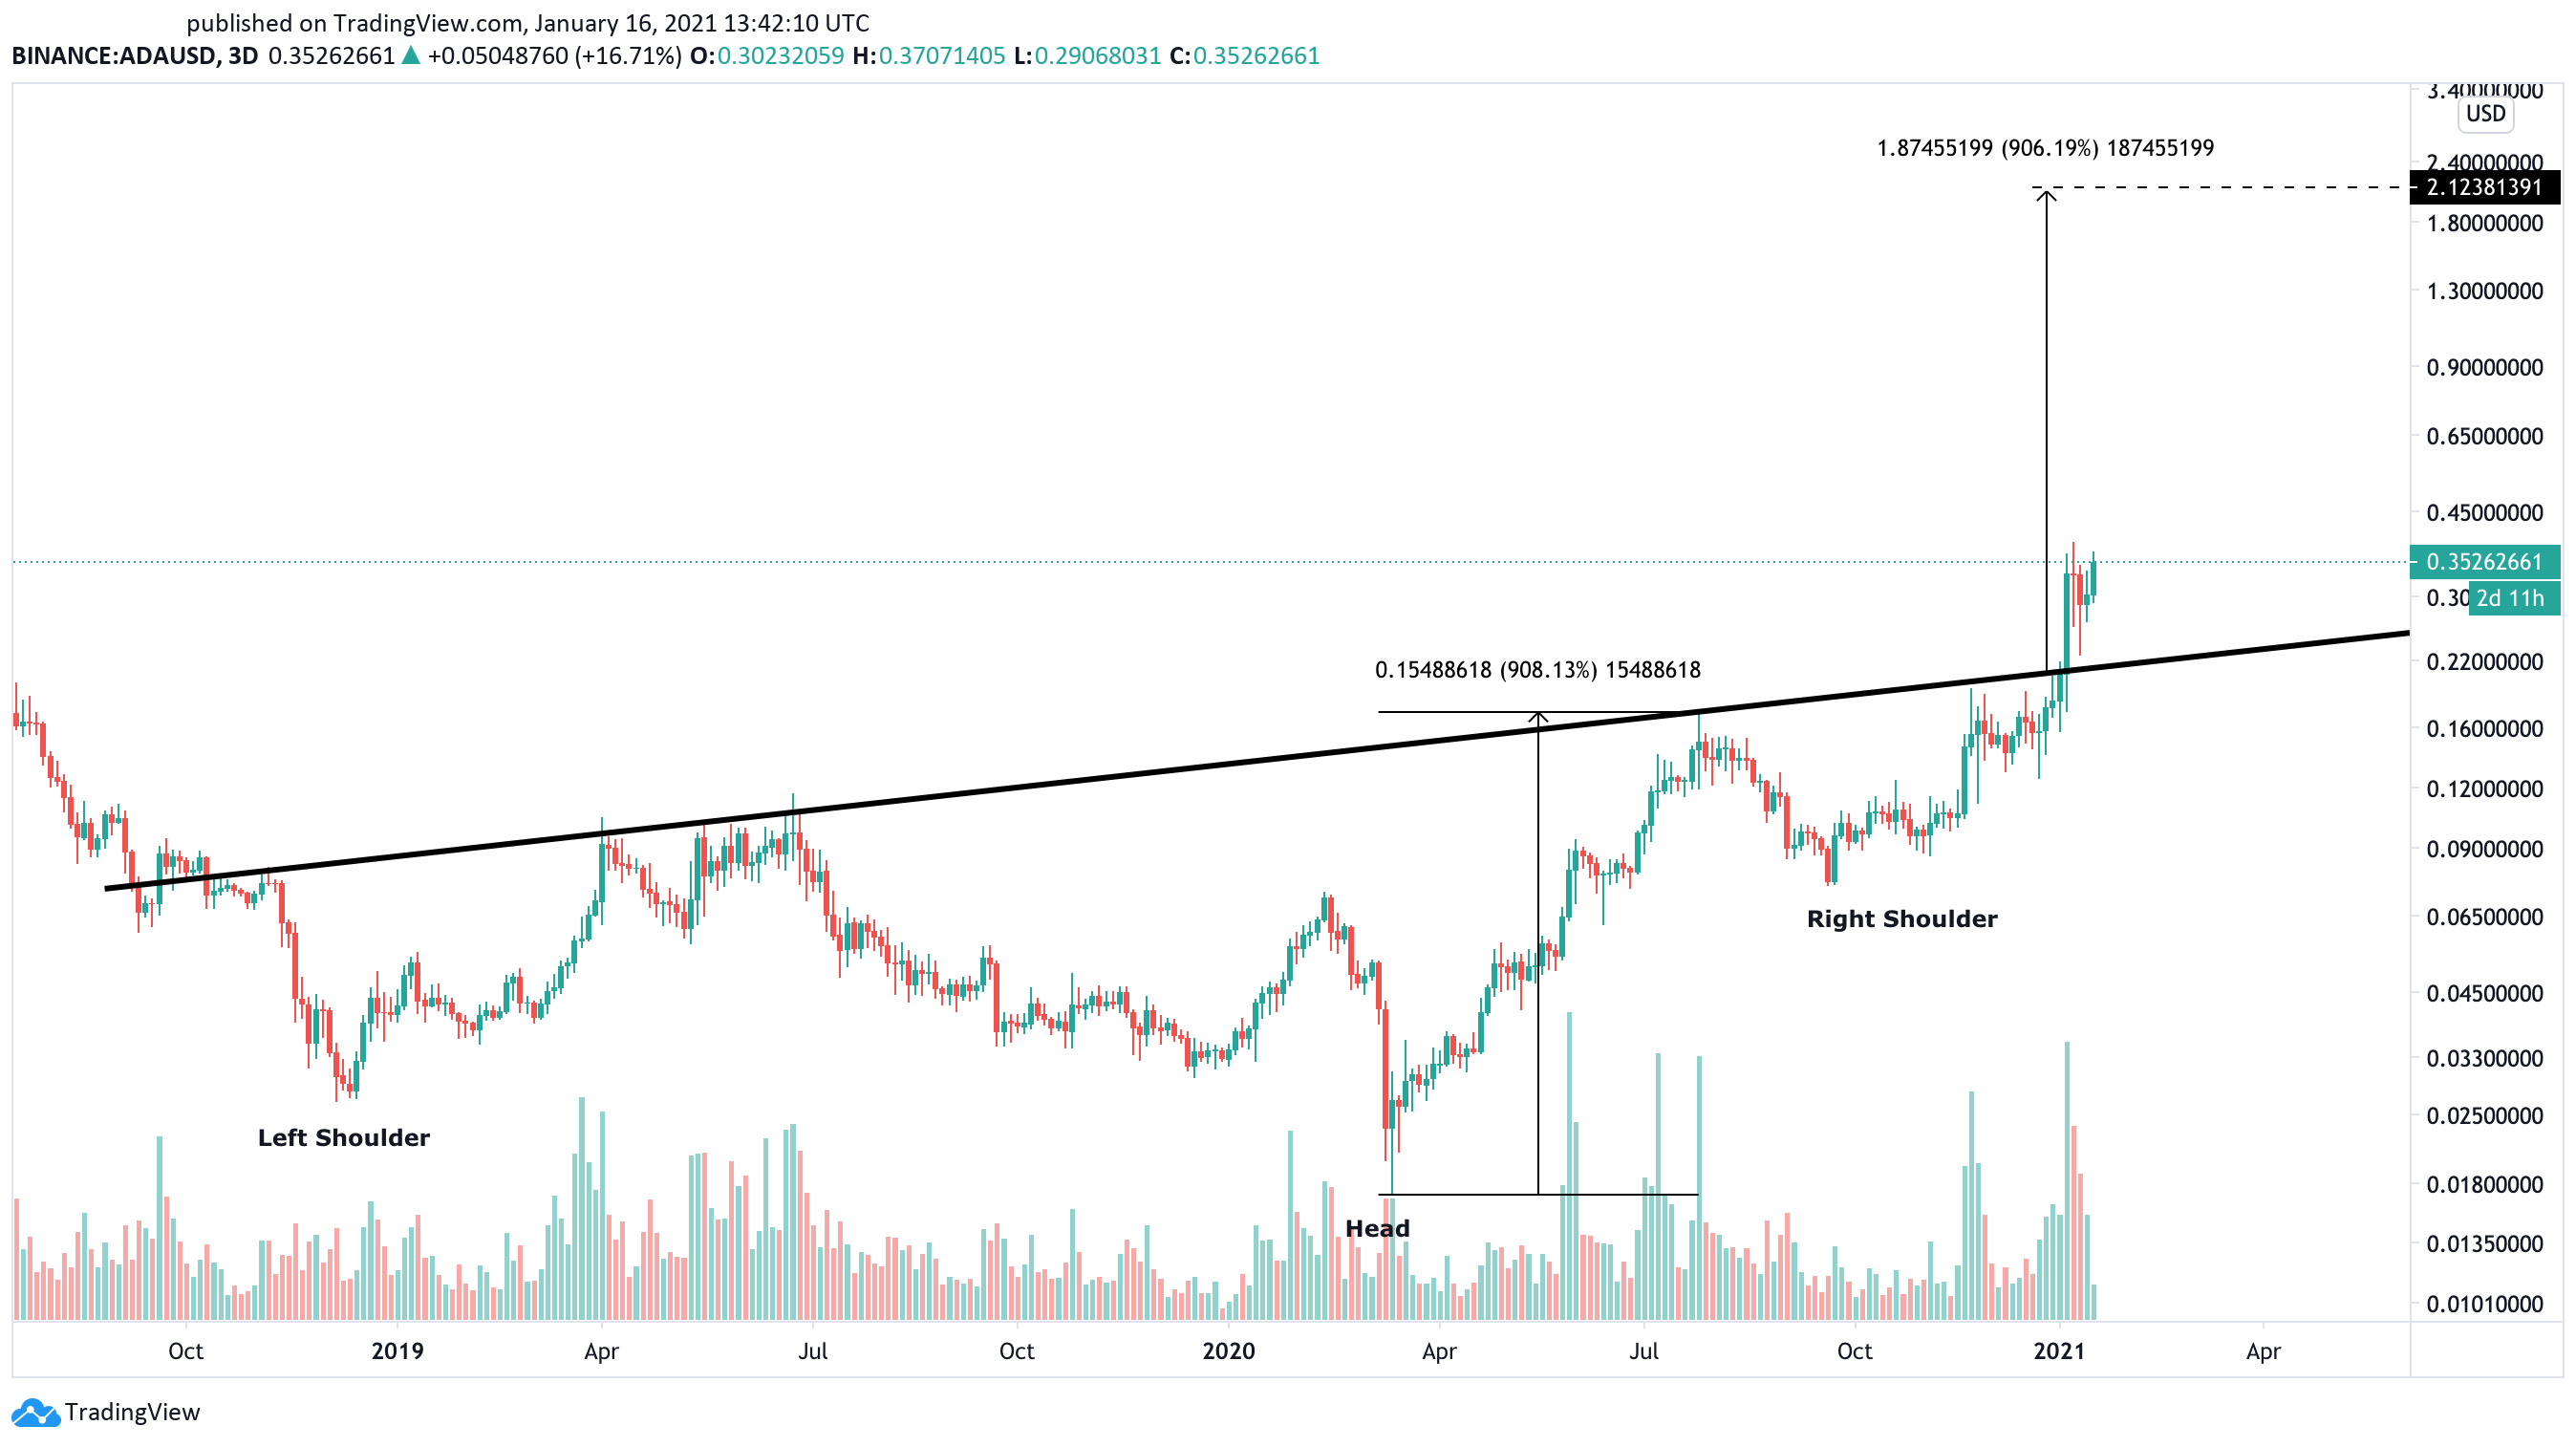
Cardano broke out of an inverse head-and-shoulders formation after consolidating for more than two years.
Moving past the $0.21 resistance barrier on Jan. 4 signaled the beginning of a new bullish cycle on this altcoin’s trend. By measuring the distance between the head and the neckline of the technical pattern and adding it to the breakout point, ADA faces an upside target of more than 900%.
If validated, ADA could see its market value rise towards $2 as forecasted by the inverse head-and-shoulders.
Cardano has already gone through an 85% upswing since it turned the $0.21 resistance level into support. This cryptocurrency appears to have peaked at a high of $0.39, which is a price level not seen since May 2018.
Given the significance of the milestone, some market participants took advantage of the bullish impulse to book profits. The spike in selling pressure around this price hurdle pushed ADA back to the underlying support, from where it bounced off quickly.
From a technical perspective, the downswing was timed by the Tom Demark (TD) Sequential indicator. This technical index presented a sell signal on ADA’s 3-day chart as prices approached $0.39.
The bearish formation led to the 42% correction towards the 61.8% Fibonacci retracement, which is often regarded as the “golden” retracement zone due to the high probability of a rebound.
Many sidelined investors enjoyed the downswing to get back into the market. As anticipated by the golden retracement zone, Cardano was able to regain lost ground and is currently trading around $0.35.
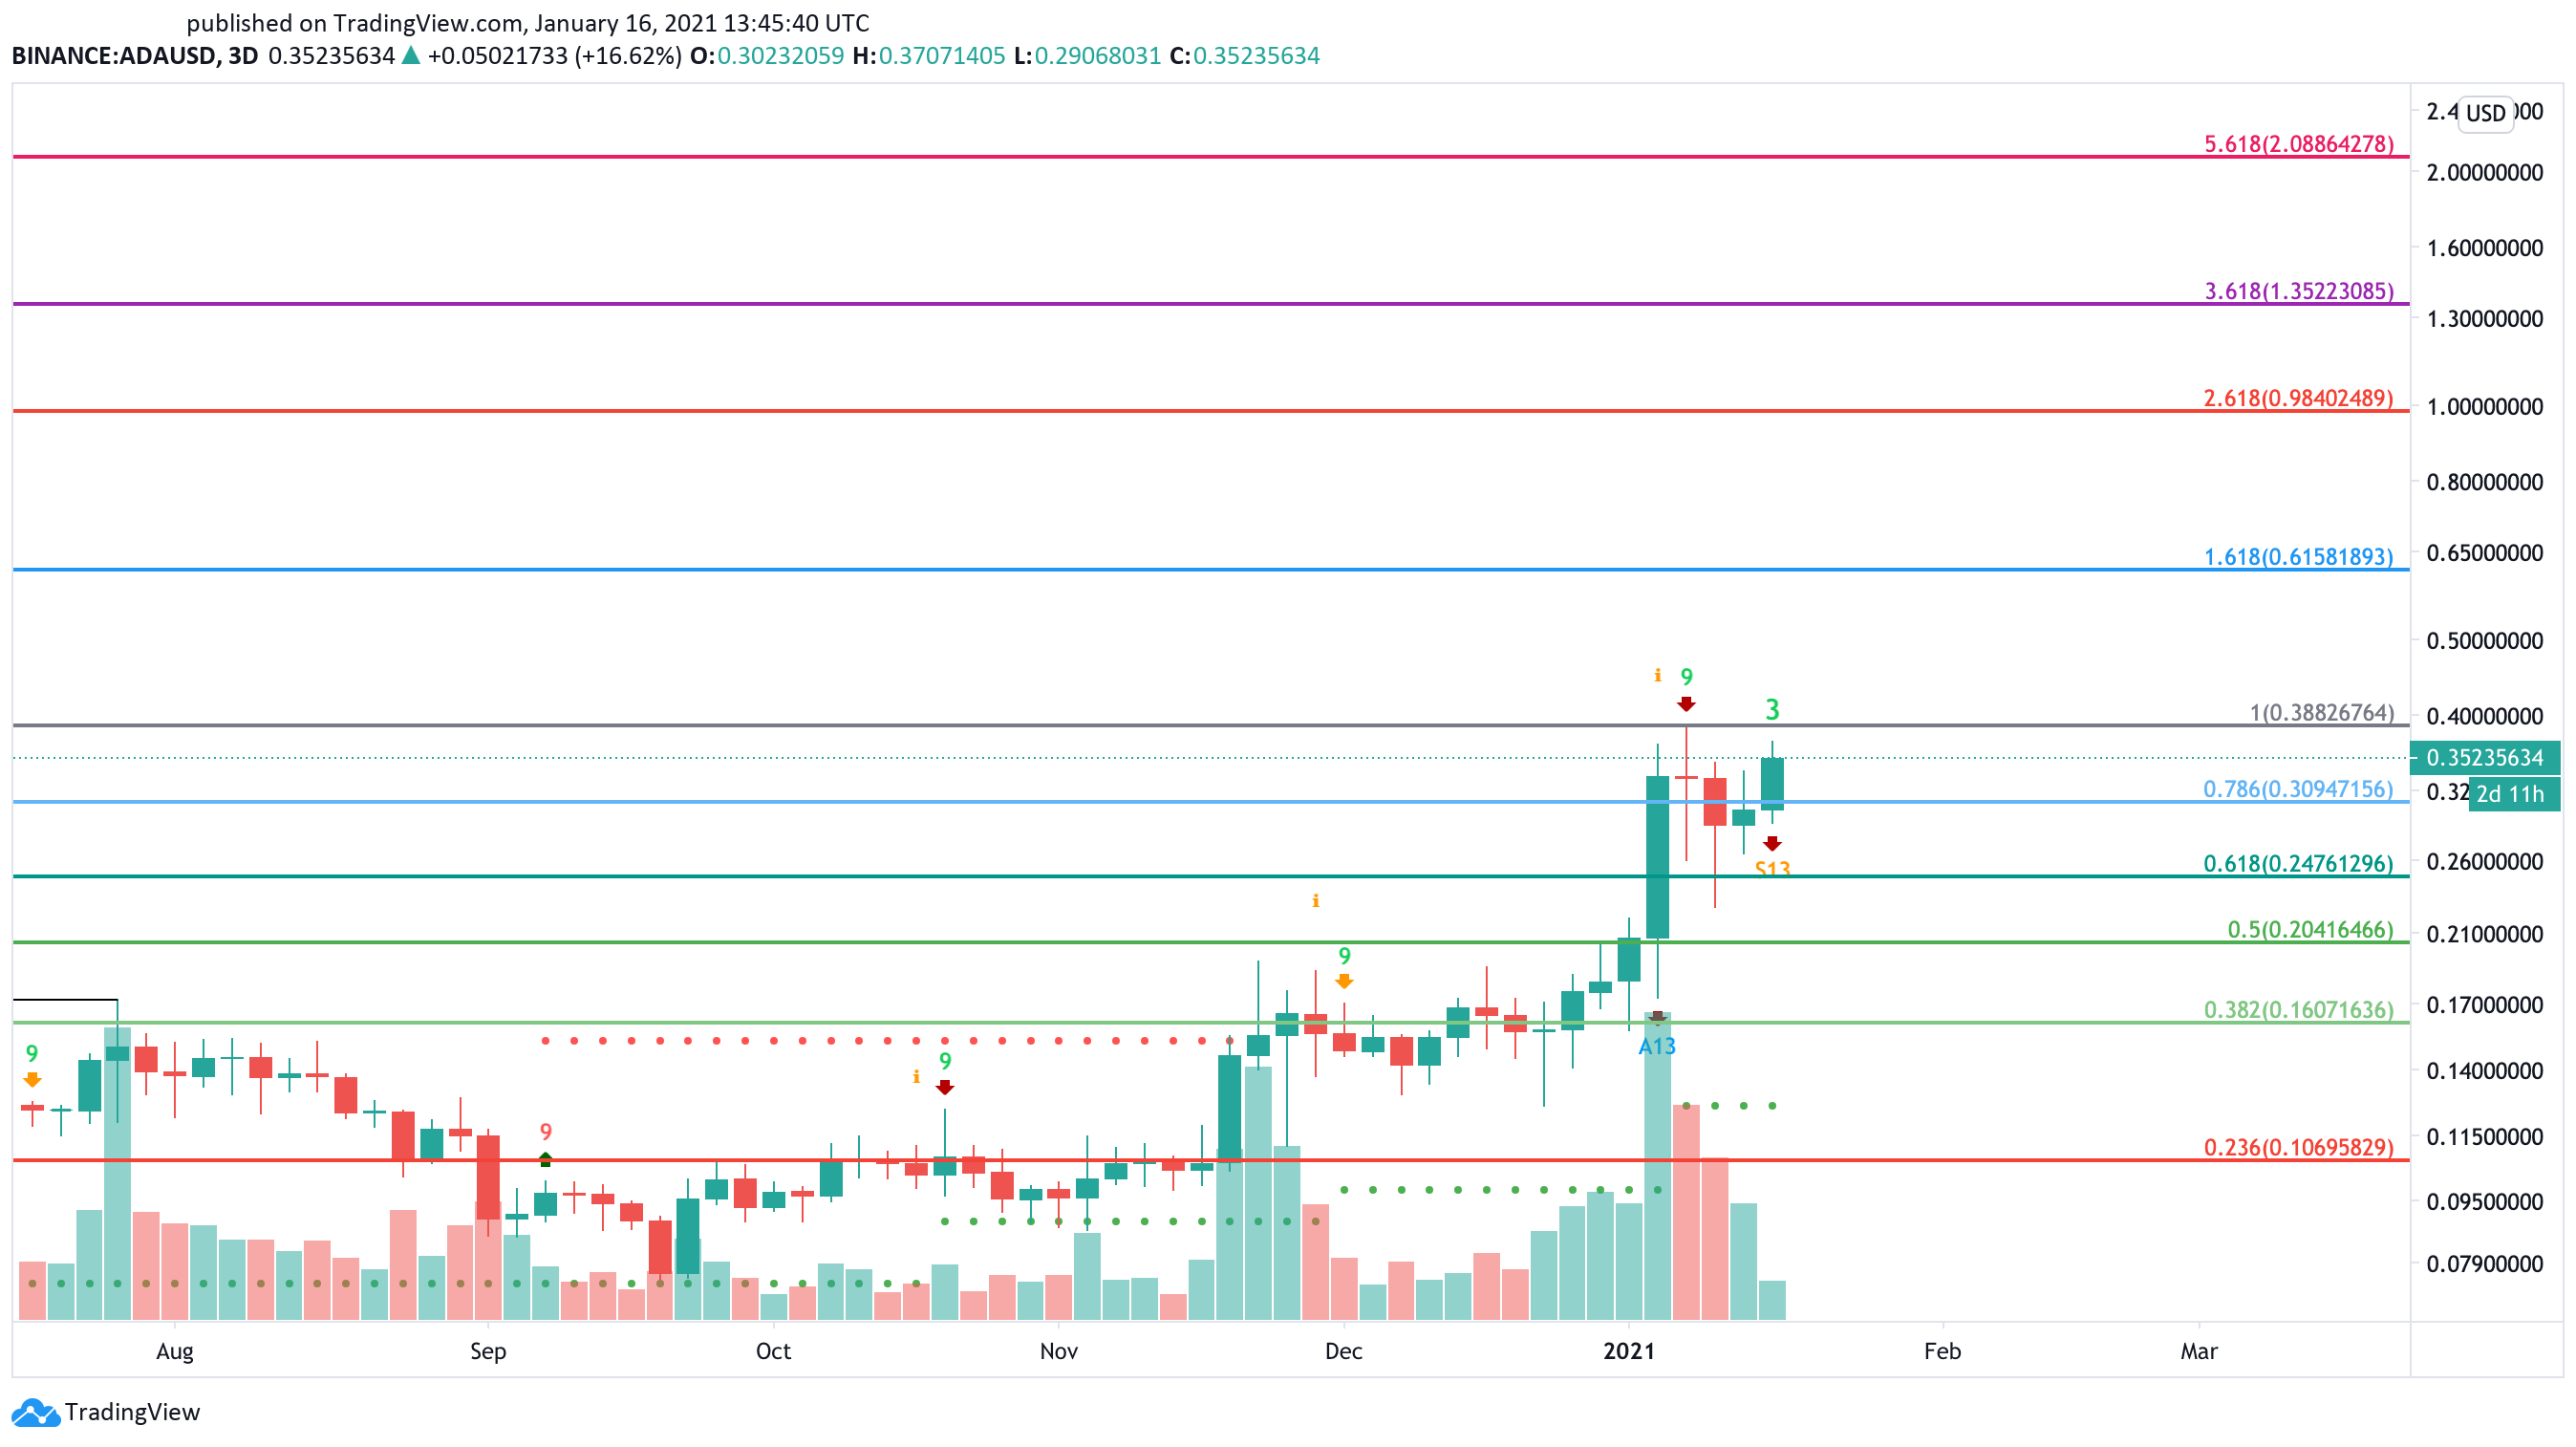
A further increase in demand for Cardano could push it above the $0.39 resistance barrier, sending it back on track to meet the inverse head-and-shoulders pattern’s target. The Fibonacci retracement indicator suggests that ADA will likely find stiff resistance on its way up around the 161.8%, 261.8%, and 361.8% levels.
These critical interest areas sit at $0.62, $0.98, and $1.35, respectively.
It is worth noting that if ADA fails to move past the overhead resistance, another sell-off may occur. But this time around, the correction could extend towards the 50% Fibonacci retracement level at $0.20.
Therefore, traders must pay close attention to how this cryptocurrency behaves as it approaches the $0.39 hurdle.
Disclosure: At the time of press, the author held Ethereum and Bitcoin.
Share this article
