Cardano Price Analysis ADA / USD: Changing Orbits
Cardano is still technically bullish, but a strong correction is likely. Medium-term outlook remains solid.

Share this article
- Cardano has a bullish short-term trading bias, with the cryptocurrency still holding above its 200-period moving average
- The medium-term prospects for the ADA / USD pair remain strongly bullish
- Both time frames show formation of bullish inverted head and shoulders patterns
Cardano / USD Short-term price analysis
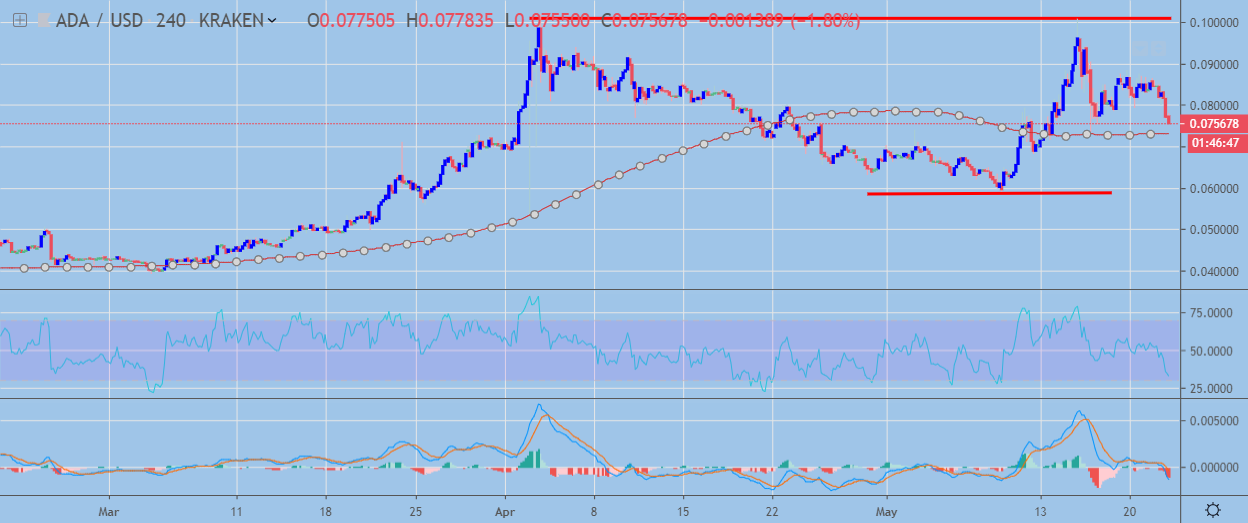
Cardano has a bullish short-term trading bias, with the cryptocurrency still holding above its 200-period moving average on the four-hour time frame.
The four-hour time frame is showing that the ADA / USD pair is starting to stage a technical correction lower after forming a large inverted head and shoulders pattern.
Technical indicators on the four-hour time frame have turned bearish and continue to move away from extremely overbought conditions.
 ADA / USD H4 Chart by TradingView
Pattern Watch
Traders should note that the inverted head and shoulders pattern will be invalidated if price moves below the current monthly trading low.
Relative Strength Index
The RSI indicator is also bearish on the four-hour time frame and shows scope for further downside.
MACD Indicator
The MACD indicator on the four-hour time frame has turned bearish and is still issuing a sell signal.
Cardano / USD Medium-term price analysis
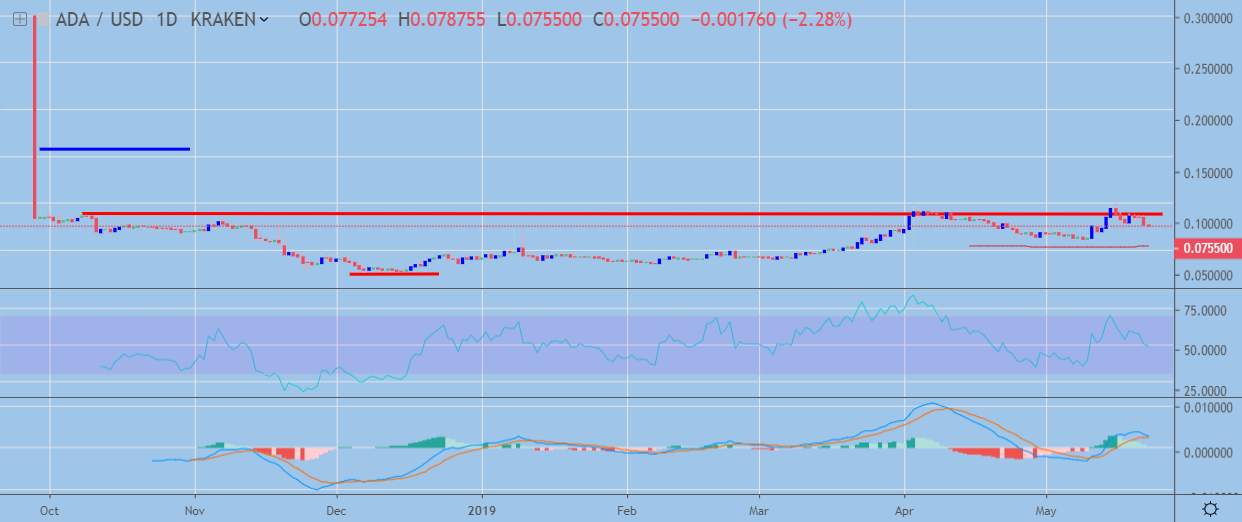
Cardano has a bullish medium-term trading outlook, with the cryptocurrency still trading well above its trend-defining 200-day moving average.
The daily time frame shows that the ADA / USD pair is testing lower after bulls were been unable to hold price above the neckline of the large inverted head and shoulders pattern.
Technical indicators on the daily time frame are turning bearish and have significant scope to correct lower.
 ADA / USD Daily Chart by TradingView
Pattern Watch
Traders should note that the inverted head and shoulders pattern has an initial upside projection that would take the ADA / USD pair towards levels not seen since October 2018.
Relative Strength Index
The RSI indicator is attempting to turn bearish on the daily time frame and shows scope for further downside.
MACD Indicator
The MACD indicator on the daily time frame is turning bearish and has scope to correct substantially lower.
Conclusion
Cardano is in the process of staging a downside technical correction after sizeable bullish patterns were formed across both the four-hour and the daily time frames.
Unless these bullish patterns are unexpectedly invalidated, traders should expect the strong bullish trend in the ADA / USD pair to remain intact.
Check out our coin guide for the Cardano project.
Cardano also received the DARE treatment, a full analysis of its merits and failings.
