Shutterstock cover by Maksym Drevynskyi and WindAwake (edited by Mariia Kozyr)
Cardano, Solana Attempt to Rebound
Cardano and Solana have dropped to vital support levels that could stop their bleeding.
Layer 1 tokens Cardano and Solana appear to have reached oversold territory after taking a nosedive in the last seven days. It remains to be seen whether these altcoins can gain the strength to bounce off crucial support.
Cardano and Solana Show Buy Signals
Cardano and Solana appear to be gearing up for bullish impulses after incurring significant losses over the past week.
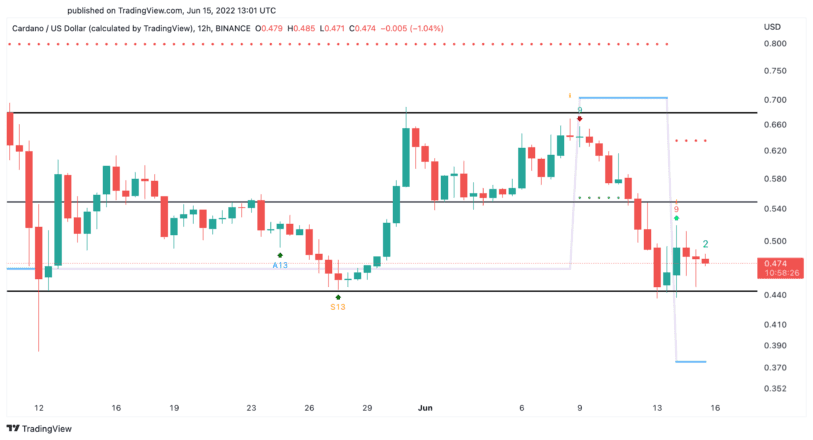
The seventh-largest cryptocurrency by market cap has dropped by more than 28% since Jun. 8. ADA recently hit a low of $0.44 and trades at around $0.47 at the time of writing. Interestingly, a buy signal formed on Cardano’s 12-hour chart, hinting at a potential rebound.
The Tom DeMark (TD) Sequential indicator recently formed a red nine candlestick, which is considered a bullish formation. The technical pattern indicates a one-to-four candlestick upswing that could help Cardano regain lost ground. A spike in buying pressure around the current price levels could trigger an upswing to $0.55 or even $0.68.
Still, Cardano must hold above the $0.44 support level to have a chance of validating the optimistic outlook. Failing to do so could lead to a spike in sell orders that sends ADA to $0.37.

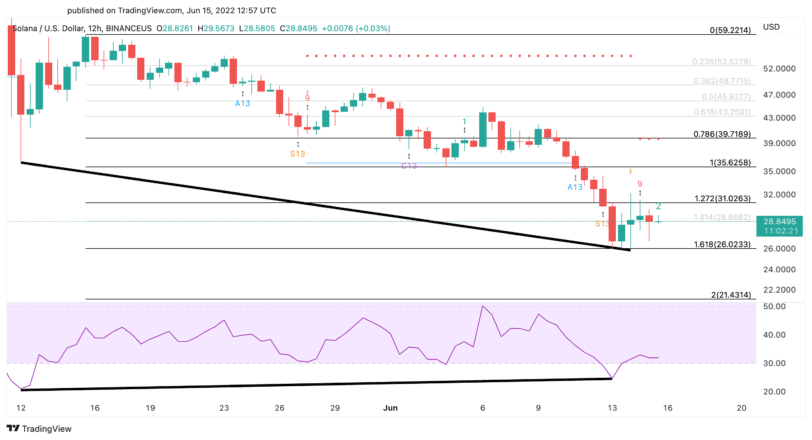
Solana has also suffered from the cryptocurrency market slump. It took a 38% hit over the past week to reach a recent low of $25.80. Although the losses incurred are significant, the RSI shows a bullish divergence, anticipating that SOL can rebound.
The TD setup adds credence to the optimistic outlook after presenting a buy signal on SOL’s 12-hour chart. It developed a red nine candlestick, which could lead to a one-to-four candlestick upswing. But to do so, Solana needs to close above $31.
Slicing through such an important resistance level could give SOL the strength to surge toward $36 or even $40. Nonetheless, Solana must hold above $26 because dipping below this support level can lead to a downswing to $21.

It is worth noting that the U.S. Federal Reserve is widely expected to raise interest rates later today. These events tend to generate a lot of volatility in the global financial markets, including the cryptocurrency market, so caution is advised.
Disclosure: At the time of writing, the author of this piece owned BTC and ETH.
