Decred / USD Technical Analysis: Trapped In The Triangle

Share this article
- Decred is bearish in the short-term with price currently trading within a descending price channel
- The daily time frame shows price trapped within a descending triangle
- The Medium-term outlook for the DCR / USD pair is extremely bearish
DCR / USD Short-term price analysis
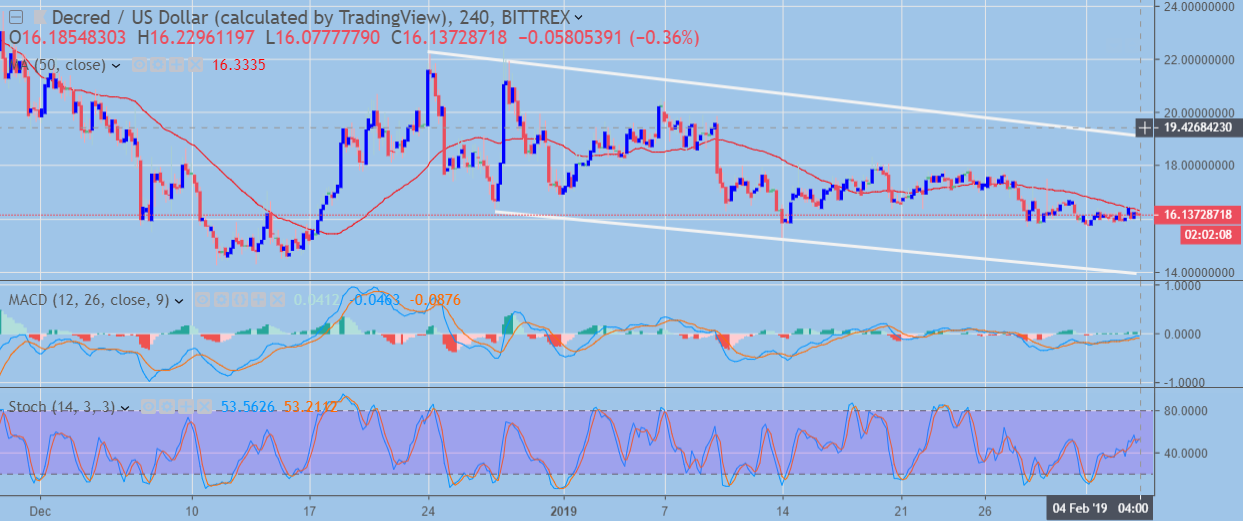
In the short-term, Decred is bearish with price currently consolidating at the middle of a descending price channel. Further losses appear likely as a bearish head and shoulders pattern has formed over the four-hour time frame.
The DCR / USD pair has been making lower price highs since early January on the four-hour time frame, further highlighting that the path of least resistance is currently to the downside.
Short-term technical indicators are starting to correct higher as price consolidates, the favored scenario at present appears to be an eventual test of the descending price channel bottom.
Pattern Watch
Aside from the descending price channel and head and shoulders pattern, a failed head and shoulders pattern can also be seen on the four-hour time frame, which is also placing bearish pressure on the DCR / USD pair in the near-term.

DCR / USD H4 Chart (Source: TradingView)
MACD Indicator
The MACD indicator is attempting to correct higher with the MACD signal line approaching neutral on the four-hour time frame.
RSI
The Relative Strength Index has turned slightly bullish on the mentioned time frame, although the recovery in the indicator appears to be losing momentum.
DCR / USD Medium-term price analysis
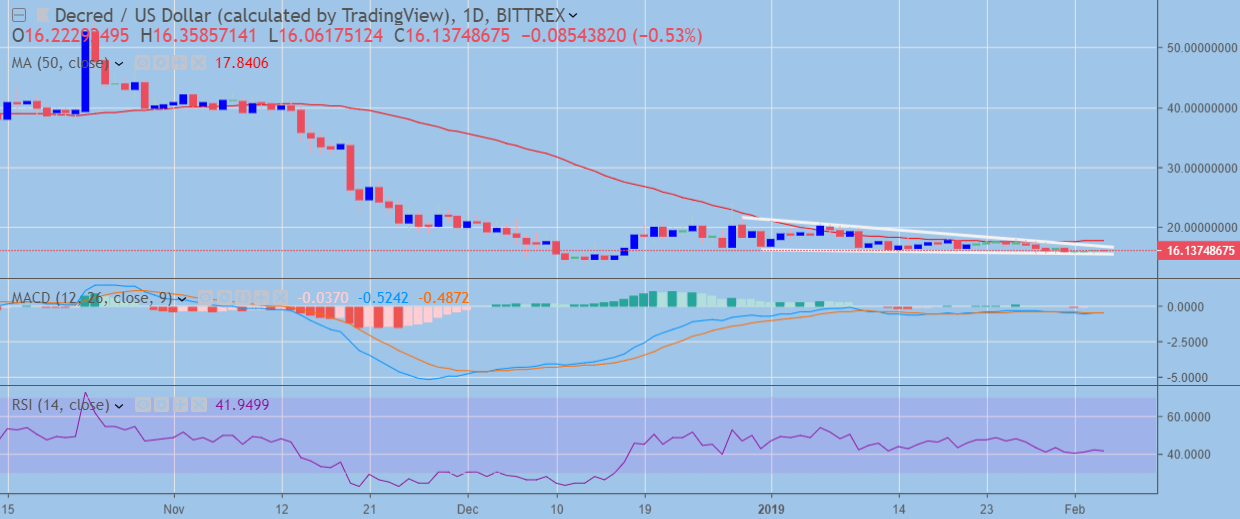
Decred is bearish in the medium-term and has been under heavy downside pressure since the cryptocurrency’s rapid decline in November of last year. Crucially, the DCR / USD pair has only been able to stage minor corrective rallies and has been gradually sliding lower.
The daily time frame is clearly showing price trading within a descending triangle pattern, the pattern is starting to narrow, which indicates that a strong directional breakout in the DCR / USD pair may soon be upon us.
In line with the prevailing bearish trend, the DCR / USD pair is likely to break to the downside and eventually challenge towards its all-time trading low.

DCR / USD Daily Chart (Source: TradingView)
Pattern Watch
Traders should carefully watch daily price closes above or below the descending triangle pattern as it will provide a strong indication of the DCR / USD pair’s medium-term directional bias.
RSI + MACD Indicators
The RSI indicator is bearish on the daily time frame and continues to move lower, while the MACD indicator currently provides no clear signal.
Conclusion
Decred is likely to remain bearish over the short and medium-term, which is in-line with the longer-term downtrend already underway. Traders looking to position themselves on the sell-side should watch for a sustained break below the descending triangle pattern on the daily time frame.
Decentral Media, Inc., the publisher of Crypto Briefing, is not an investment advisor and does not offer or provide investment advice or other financial advice. Nothing on this website constitutes, or should be relied on as, investment advice or financial advice of any kind. Specifically, none of the information on this website constitutes, or should be relied on as, a suggestion, offer, or other solicitation to engage in, or refrain from engaging in, any purchase, sale, or any other any investment-related activity with respect to any transaction. You should never make an investment decision on an investment based solely on the information on our website, and you should never interpret or otherwise rely on any of the information on this website as investment advice. We strongly recommend that you consult a licensed investment advisor or other qualified financial professional if you are seeking investment advice on an investment.
