Photo: Doge/Kabosu by Atsuko Sato
Dogecoin Looks Poised to Break Out
Dogecoin is sitting at a make-or-break point that could lead to a 28% price movement.
Dogecoin looks ready for a volatile move as it moves towards the apex of a symmetrical triangle.
Dogecoin Is Primed for Major Move
Dogecoin could be ready for a breakout.
While some altcoins have entered price discovery mode, others continue consolidating within a tight range.
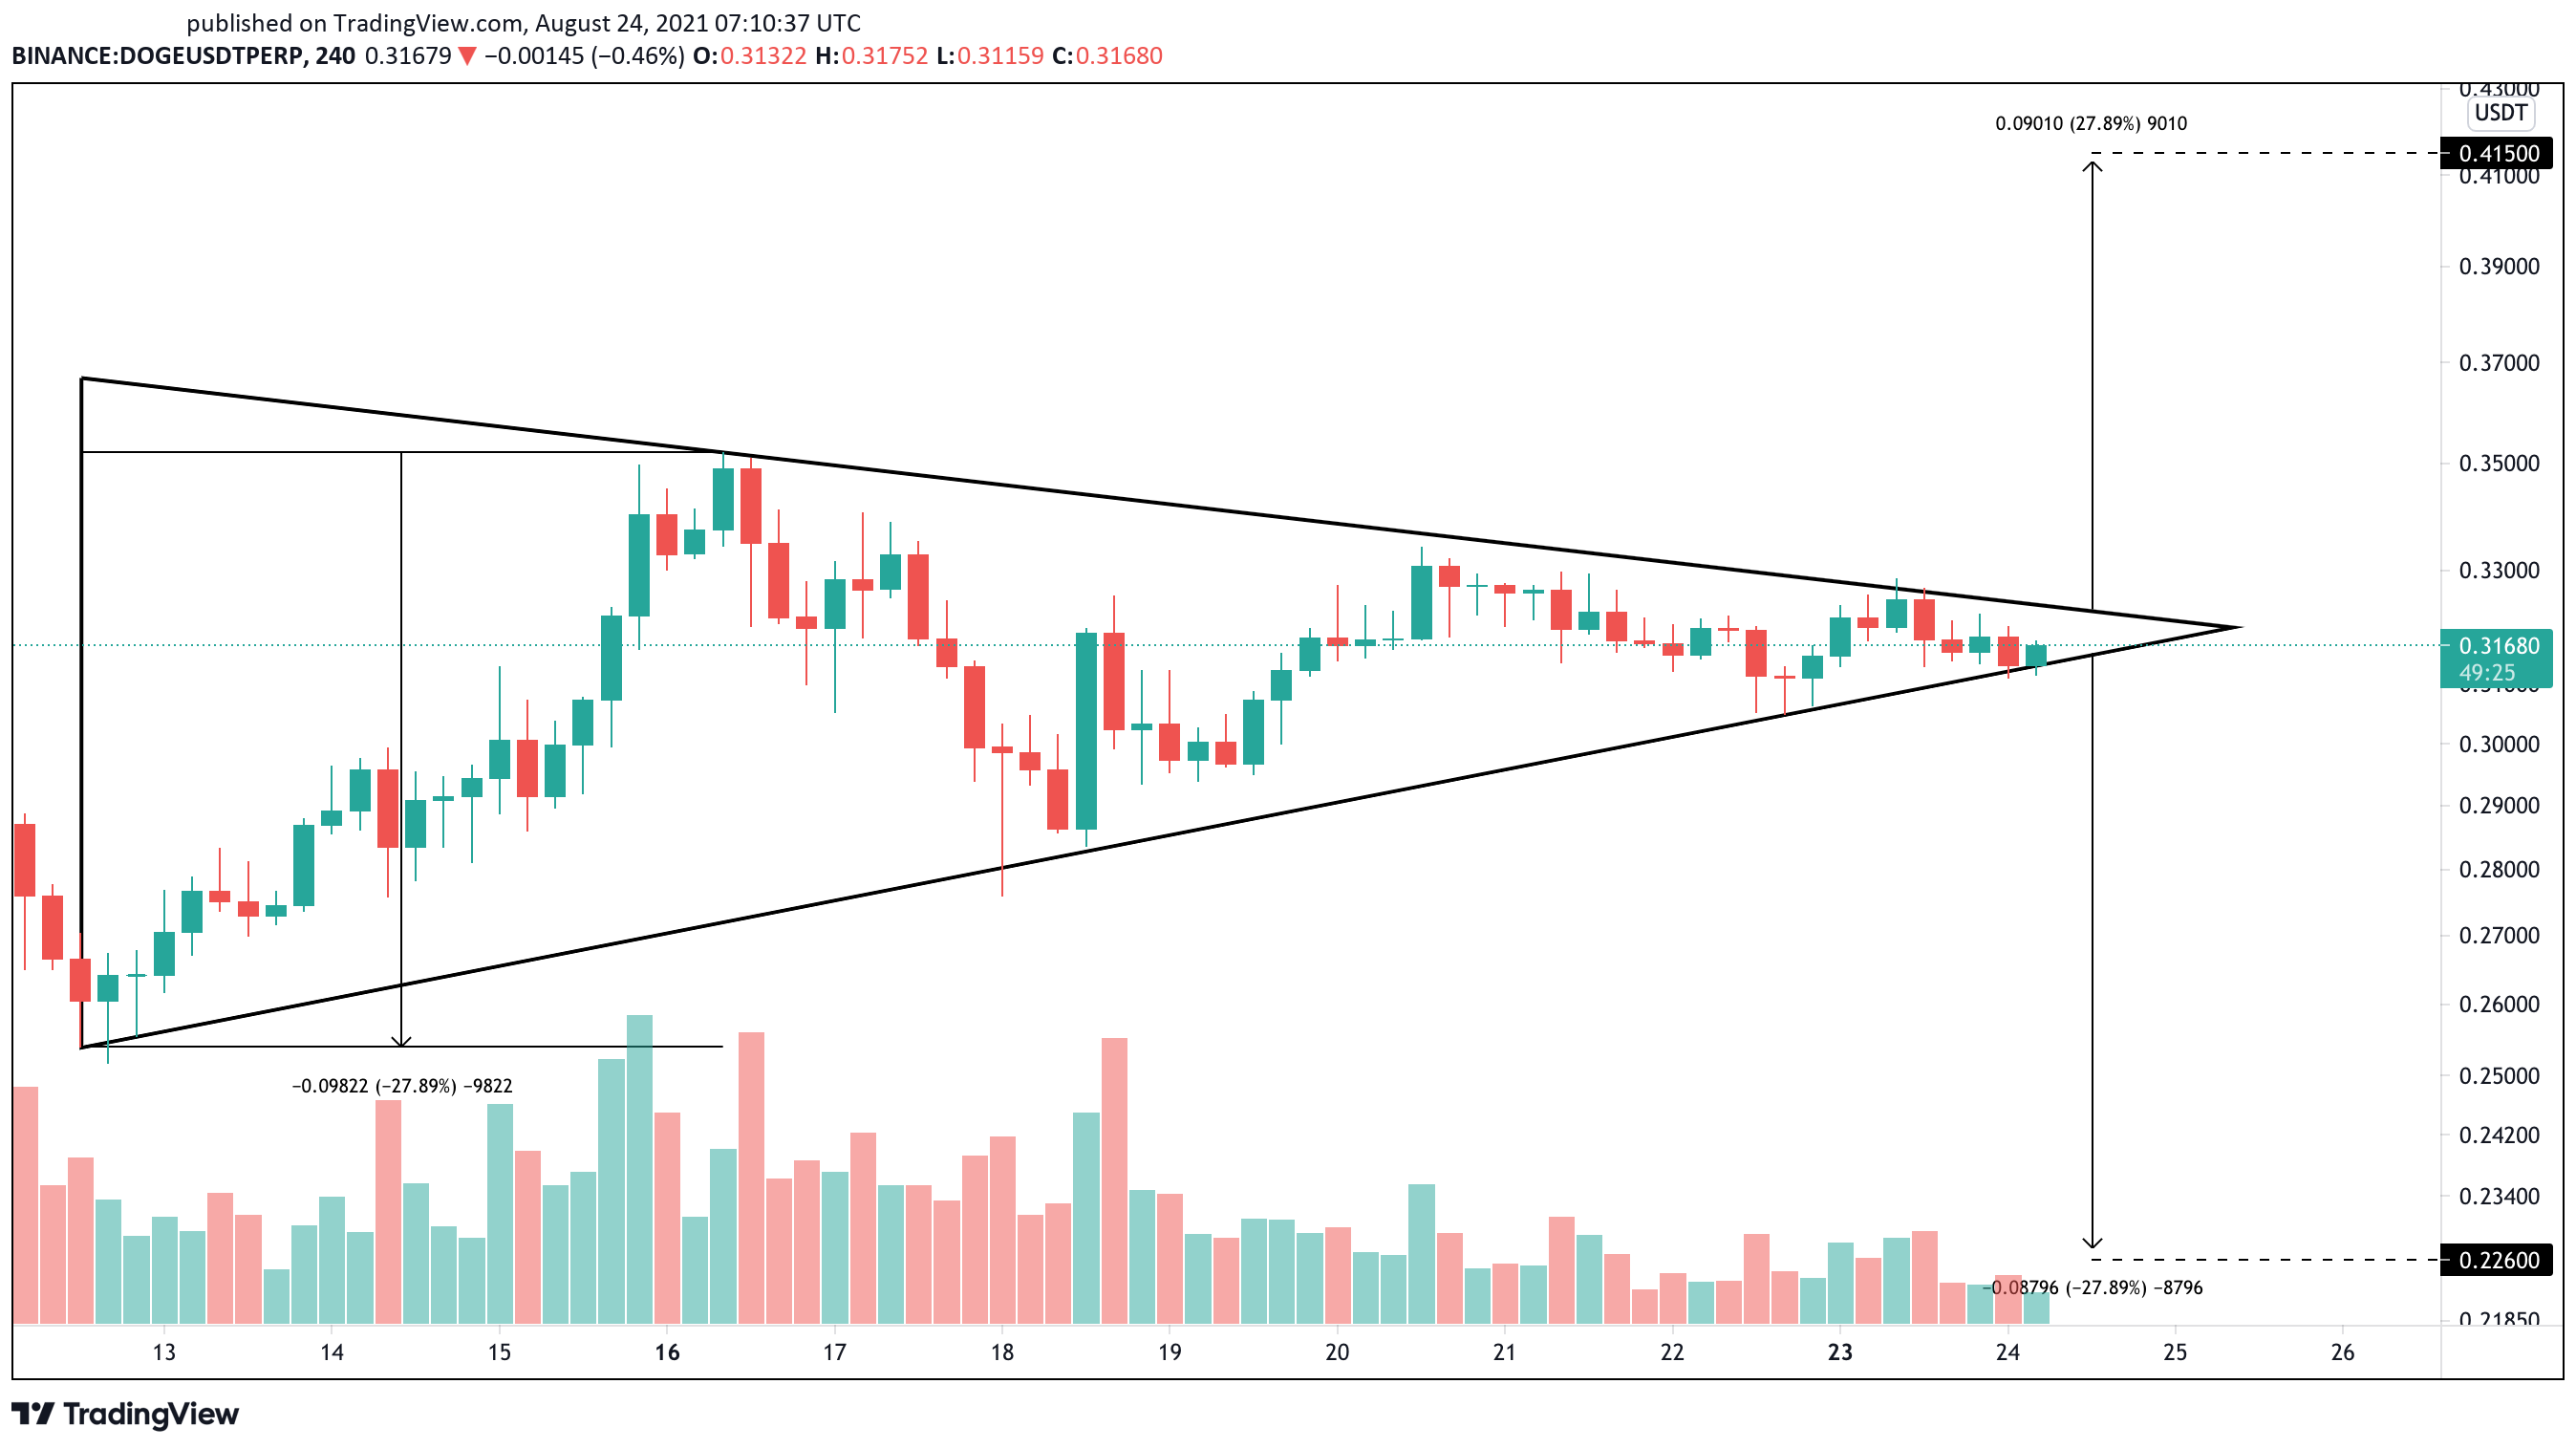
Dogecoin is one of the cryptocurrencies that has considerably slowed down its uptrend. The meme coin has been making a series of lower highs and higher lows since Aug. 12 without providing a clear signal of where it is heading next.
On DOGE’s 4-hour chart, it appears that the recent price action has led to the formation of a symmetrical triangle. As the seventh-largest cryptocurrency by market cap edges closer to the triangle’s apex, it signals that a significant price movement is underway.
A decisive 4-hour candlestick close above or below the $0.310-$0.326 range would likely define Dogecoin’s price trend.

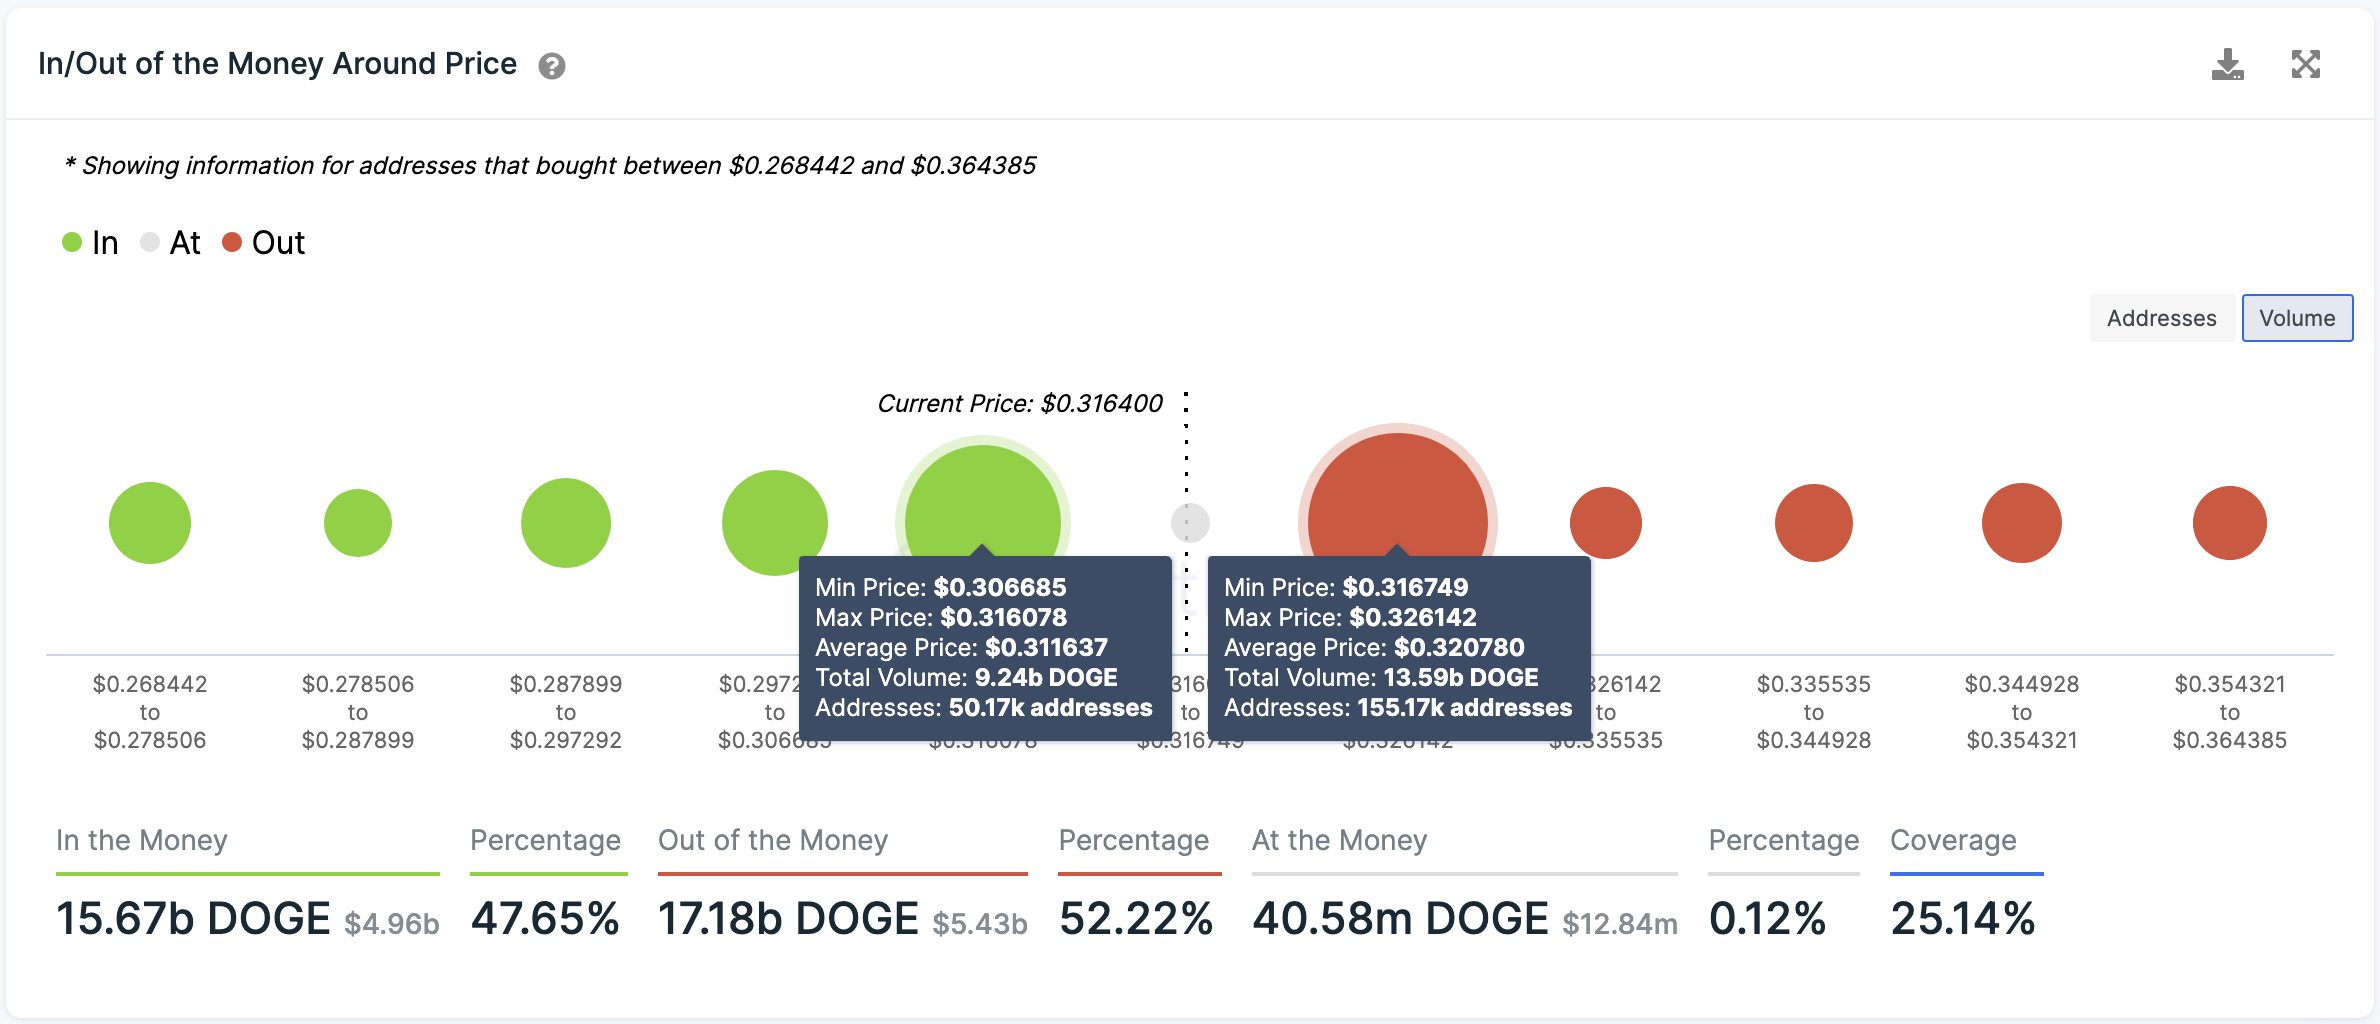
Transaction history shows the importance of the $0.310-$0.326 price range.
Based on IntoTheBlock’s In/Out of the Money Around Price (IOMAP) model, more than 155,000 addresses have previously purchased nearly 13.6 billion DOGE between $0.317 and $0.326. Meanwhile, over 50,000 addresses hold roughly 9.4 billion DOGE purchased between $0.307 and $0.316.
Given the magnitude of this supply zone, it is reasonable to wait for either barrier to be broken before entering any long or short positions.

A sudden increase in buying pressure that allows Dogecoin to slice through the overhead resistance wall could lead to a 28% upswing toward $0.415. But if sell orders begin to pile up and DOGE closes below the underlying support, it could see its price drop to $0.226.
These targets are determined by measuring the triangle’s y-axis and adding it to the breakout point.
