EOS Price Analysis EOS / USD: Strong Buying
EOS is looking solid as bulls dominate over all time frames, while getting ready to test new highs for the year.

Share this article
- EOS has a bullish short-term outlook, with the cryptocurrency testing back towards the best levels of the year so far.
- The four-hour time frame shows that buyers have invalidated a head and shoulders pattern
- The daily time still shows bullish MACD divergence is present from June 2018
EOS / USD Short-term price analysis
EOS has a bullish short-term outlook, with the cryptocurrency testing back towards the best trading levels of the year so far.
The four-hour time frame shows that buyers have invalidated a bearish head and shoulders pattern, with the July 2018 monthly high being the current bullish target.
Technical indicators on the four-hour time frame have turned bullish and are showing scope for further upside.
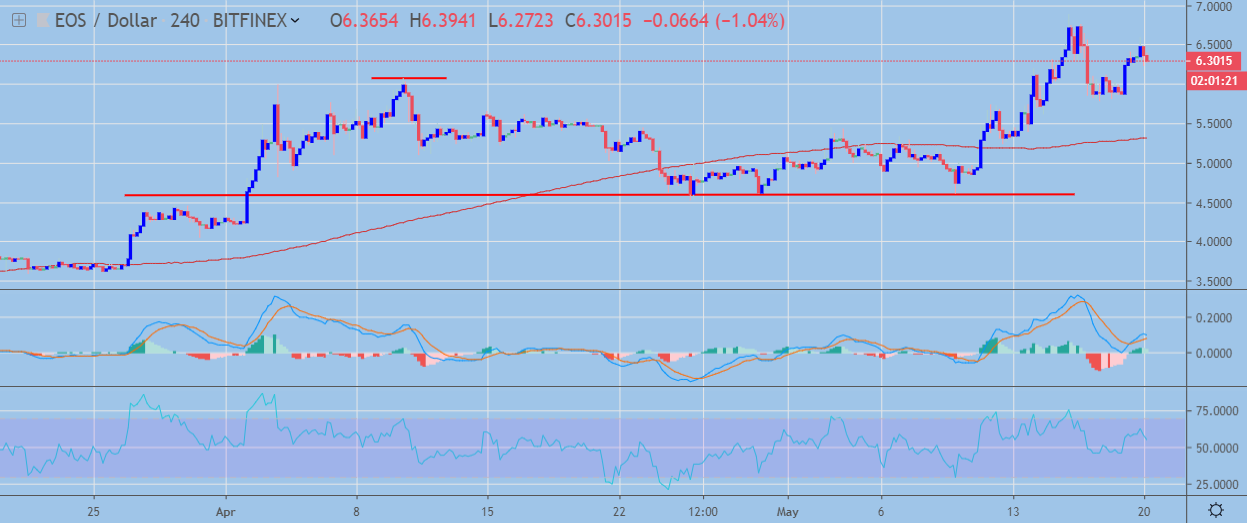 EOS / USD H4 Chart by TradingView
Pattern Watch
Traders should note that a bullish inverted head and shoulders pattern has also been created on the four-hour time frame.
Relative Strength Index
The RSI indicator has also turned bullish on the four-hour time frame and shows scope for further gains.
MACD Indicator
The MACD indicator on the four-hour time frame has turned bullish and shows scope for further upside.
EOS / USD Medium-term price analysis
EOS has a bullish trading bias over the medium-term, with the cryptocurrency well supported by strong dip-buying demand.
The daily time frame shows that a large inverted head and shoulders pattern has been created, with buyers attempting to move price above the neckline of the bullish pattern.
Technical indicators are bullish on the daily time and continue to point to further medium-term upside.
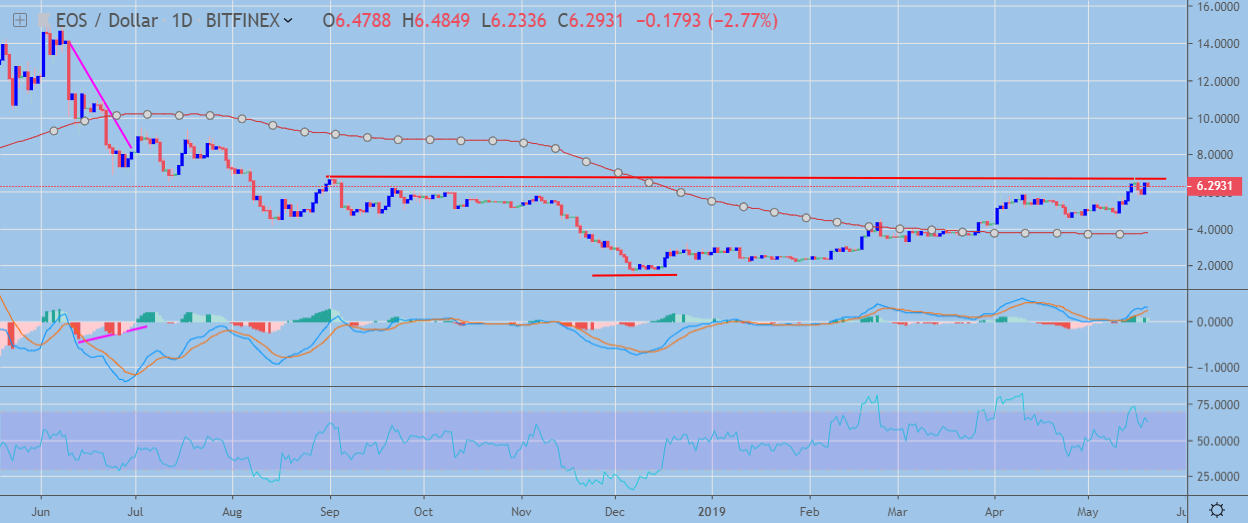 EOS / USD Daily Chart by TradingView
Pattern Watch
Traders should note that the upside projection of the bullish pattern would erode the bullish MACD price divergence that has been present on the daily time frame since June 2018.
Relative Strength Index
The Relative Strength indicator is bullish on the daily time and shows scope for further upside.
MACD Indicator
The MACD indicator on the daily time frame is generating a buy signal and also shows bullish MACD price divergence from June 2018.
Conclusion
EOS is increasingly bullish over both time horizons, with the four-hour time frame pointing towards continued near-term upside in the cryptocurrency.
The creation of the bullish pattern on the daily time frame suggests strong gains for the EOS / USD pair over the medium-term, which will likely eradicate the presence of any bullish MACD price divergence.
Check out our coin guide for the EOS project.
Share this article
