EOS / USD Technical Analysis: Going Lower

Share this article
- EOS is bearish in the short-term with the pair correcting lower as bearish MACD divergence reverses
- The medium-term outlook for the cryptocurrency remains bearish after a failed attempt to move above its 200-day moving average
- Technical rejection from neckline resistance is also weighing on the EOS / USD pair.
EOS / USD Short-term price analysis
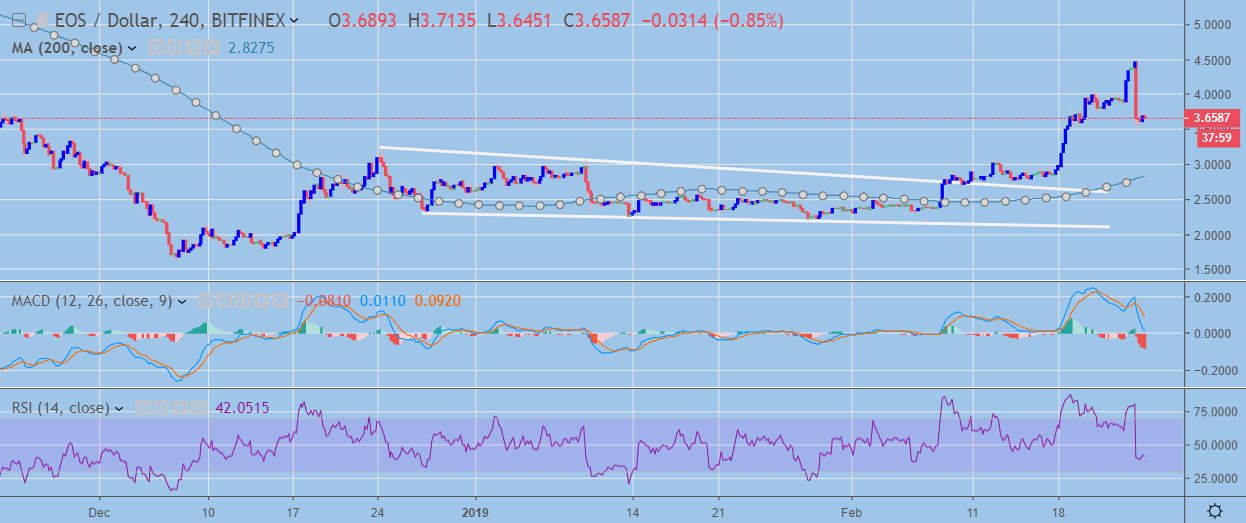
In the short-term, EOS has turned bearish following a strong technical reversal in the cryptocurrency from the 4.500 resistance level.
The EOS / USD pair had been enjoying a strong bullish rally, although the move higher had been creating a sizeable amount of bearish MACD divergence on the four-hour time frame.
Despite the strong bearish reversal, the four-hour time frame still shows large amounts of bearish MACD divergence remain, which if reversed would take the EOS / USD pair back towards the 3.000 level.

EOS / USD H4 Chart (Source: TradingView)
Pattern Watch
Traders should watch for a possible technical correction back toward the falling wedge pattern on the four-hour time frame. The EOS / USD pair’s 200-period moving average is also expected to provide strong support if the decline continues.
MACD
The MACD indicator has turned bearish, with the MACD histogram trending lower with a bearish line crossover also underway.
Relative Strength Index
The RSI indicator has now turned bearish on the four-hour time frame after becoming overbought and also signaling bearish RSI price divergence.
EOS / USD Medium-term price analysis
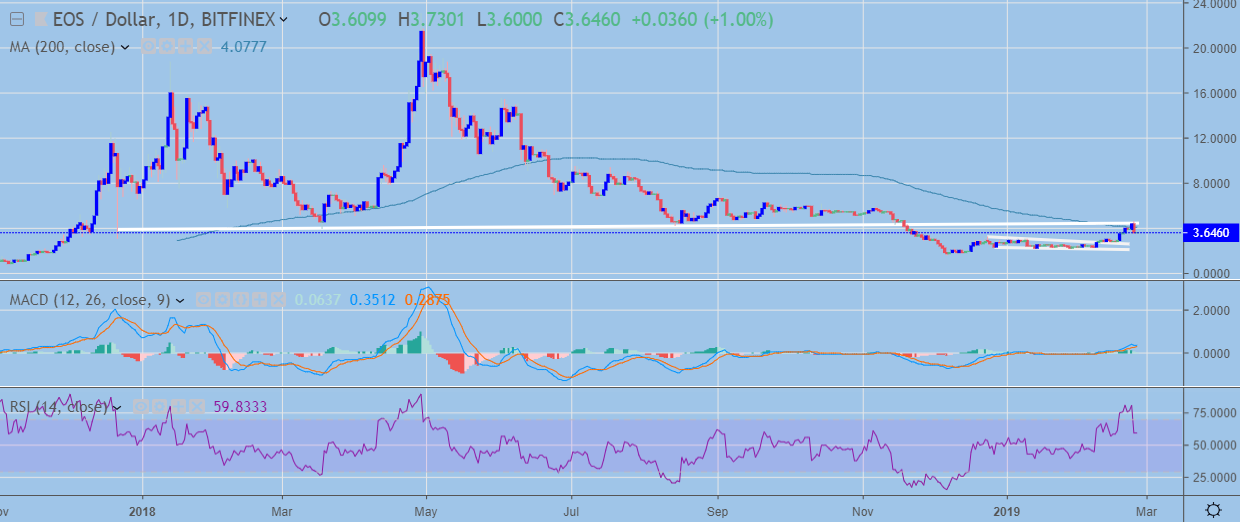
EOS is bearish in the medium-term, with the cryptocurrency coming under heavy selling pressure after testing its 200-day moving average for the first time since mid-June 2018.
The EOS / USD pair also failed to move above the neckline of a large head and shoulders pattern on the daily time frame, signaling that pressure remains to the downside.
Technicals are correcting from overbought conditions, with the MACD indicator on the daily time already reversing bearish MACD divergence created over the weekend.

EOS / USD Daily Chart (Source: TradingView)
Pattern Watch
Traders should expect selling pressure to remain on the EOS / USD pair while price continues to trade below the neckline of the head and shoulders pattern.
MACD
The MACD indicator on the daily time frame remains bullish, although traders should watch for multiple bearish daily candles to signal the bearish reversal accelerating.
Relative Strength Index
The Relative Strength Index has reversed from extremely overbought conditions on the daily time and is still trading above neutral.
Conclusion
EOS is starting to correct lower in the short-term after creating large pockets of bearish MACD divergence during its recent surge higher. Overall, the EOS / USD pair has scope to trade significantly lower until the divergence is completely reversed.
Traders should expect the cryptocurrency’s medium-term outlook to remain bearish while price trades below its 200-day moving average and the neckline of the head and shoulders pattern.
Decentral Media, Inc., the publisher of Crypto Briefing, is not an investment advisor and does not offer or provide investment advice or other financial advice. Nothing on this website constitutes, or should be relied on as, investment advice or financial advice of any kind. Specifically, none of the information on this website constitutes, or should be relied on as, a suggestion, offer, or other solicitation to engage in, or refrain from engaging in, any purchase, sale, or any other any investment-related activity with respect to any transaction. You should never make an investment decision on an investment based solely on the information on our website, and you should never interpret or otherwise rely on any of the information on this website as investment advice. We strongly recommend that you consult a licensed investment advisor or other qualified financial professional if you are seeking investment advice on an investment.
