Ethereum Correction Before Resuming Bullish Trend, Shows Indicators
The smart contract platform has several levels of resistance ahead of it

Share this article
Ethereum faces strong resistance ahead of it, with several indicators suggesting that ETH will correct before continuing its bullish trend.
Ethereum Faces Strong Resistance
Following a six-months-long correction, Ethereum hit a bottom of $117 in mid-December 2019. Since then, the smart contracts leader has seen its price surge by nearly 100%, reaching a yearly high of $230. Now, ETH appears to be testing a significant resistance level that could prevent it from advancing further.
According to IntoTheBlock, a machine learning and statistics modeling firm, the $227 price level represents a major barrier for Ethereum. Based on the firm’s “In-Out of the Money Around Current Price” (IOMAP) model, there are over 506,000 addresses collectively holding 3.67 million Ether between $224 and $231. ETH could fail to break through on its first pass at this price level given the high levels of supply.
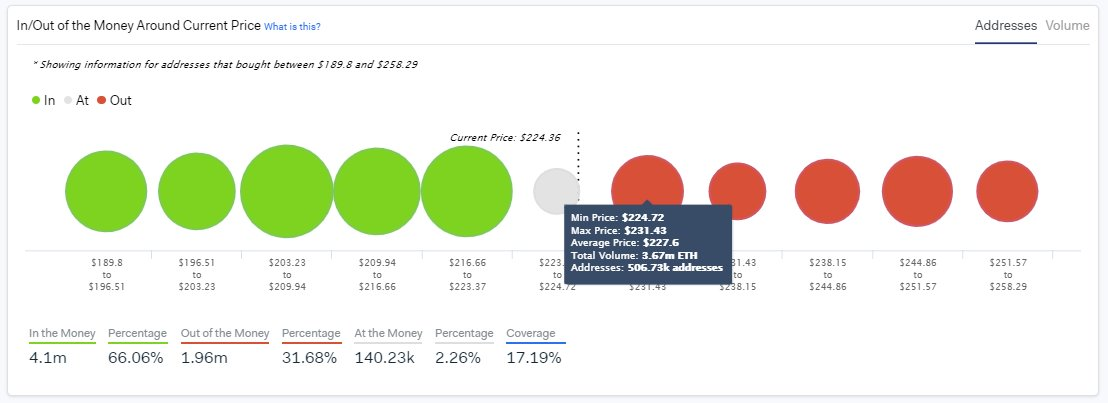
The IOMAP reveals that a rejection off the $227 resistance level could trigger a correction to the next significant support that sits between $209 and $216. Around this price level there are over 838,000 addresses containing 4.02 million Ether.
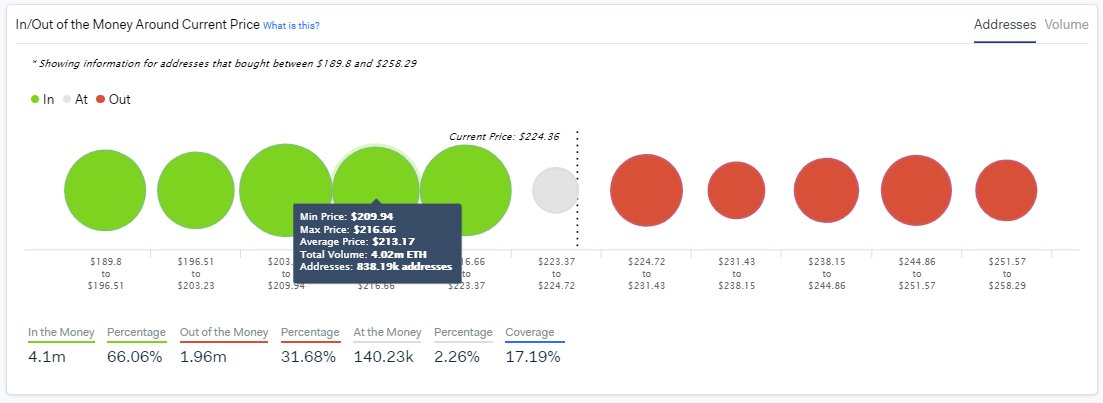
After Ethereum’s latest rally, a pullback from the current price levels seems reasonable since it would help maintain the uptrend healthy. Sidelined investors would likely see such a bearish impulse as an opportunity to get back into the market. A new inflow of capital could take ETH back up to retest the $227 resistance level once again.
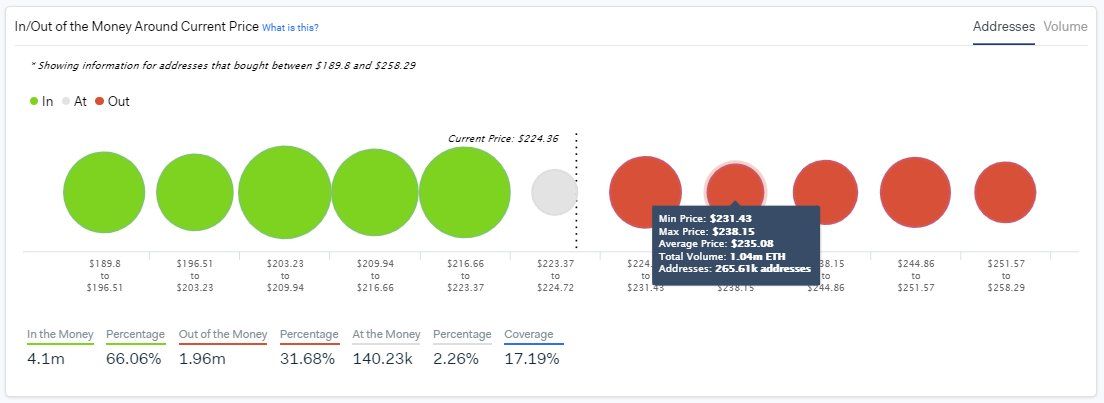
If the buying pressure behind Ether is strong enough, it could even allow it to finally break through the $227 mark. Moving above this hurdle could take this cryptocurrency to the next level of resistance that sits between $231 and $238, according to IntoTheBlock. Here 265,000 addresses, with balances totaling over 1.04 million ETH, serve as the next resistance level.
Technical Patterns Estimate a Correction
A similar scenario to the one presented by IntoTheBlock is visible on ETH’s 1-day chart. Within this timeframe, the TD sequential indicator gave two sell signals—one in the form of an aggressive 13 and the other as a sequential 13. The bearish formation estimates that the uptrend could soon reach an exhaustion point, triggering a one to four candlestick correction or the beginning of a new downward countdown.
Nevertheless, Ethereum is currently on a green seven candlestick based on this technical index. Thus, this cryptocurrency could see two more green candlesticks before a sell signal is presented in the form of a green nine candle.
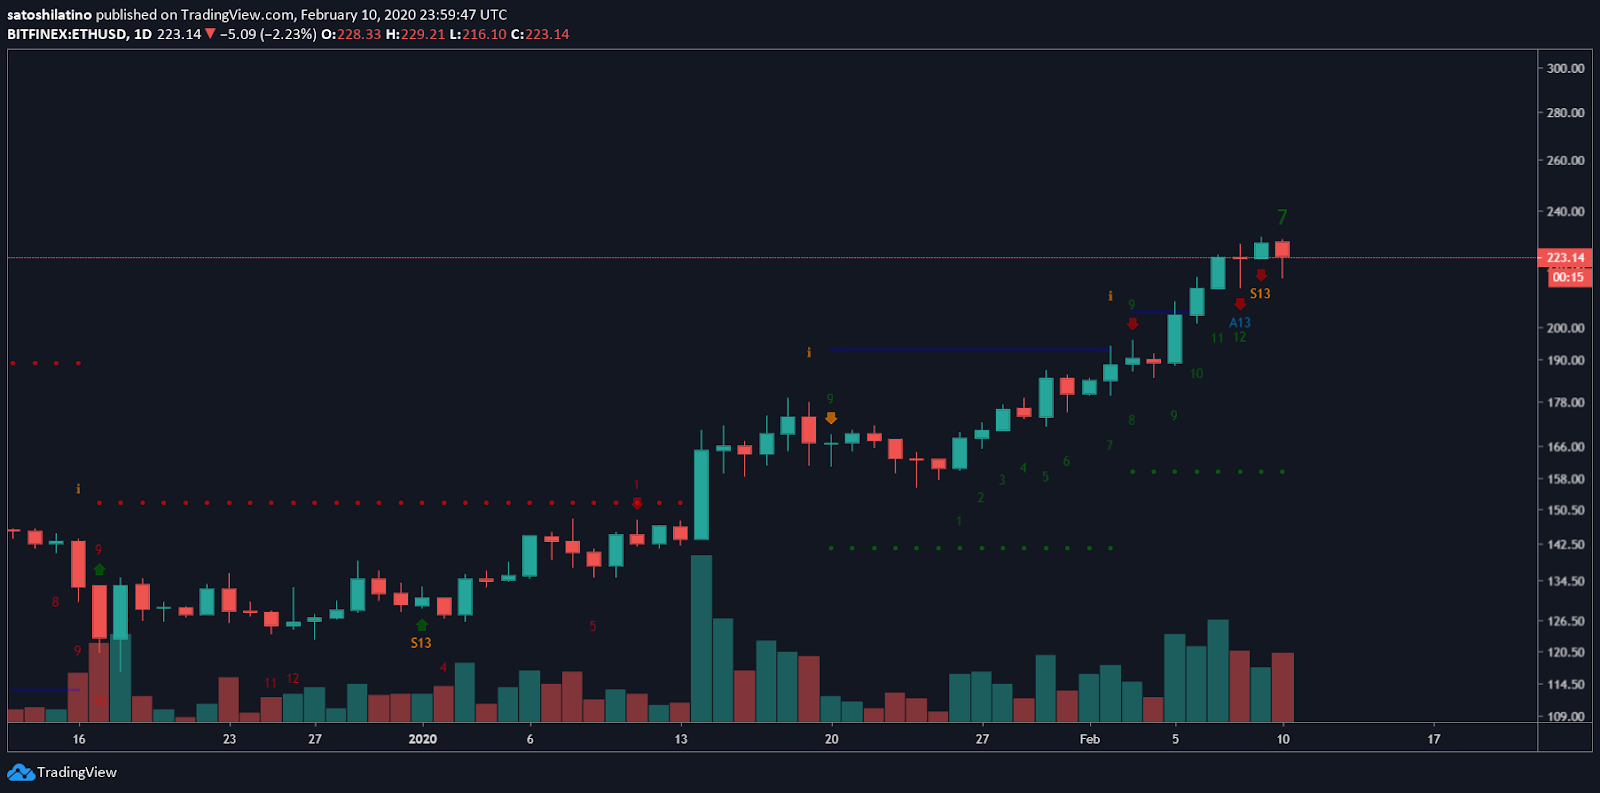
A spike in the selling pressure behind Ethereum around the current price levels could validate the sell signals presented by the TD sequential indicator. If this happens, then Ether could plunge to the 78.6% Fibonacci retracement level at $206. This is where IntoTheBlock sees a significant support level, but breaking below that mark could trigger a steeper correction.
The next levels of support are given by the 61.8% and the 50% Fibonacci retracement level. These hurdles sit at $187 and $174, respectively.
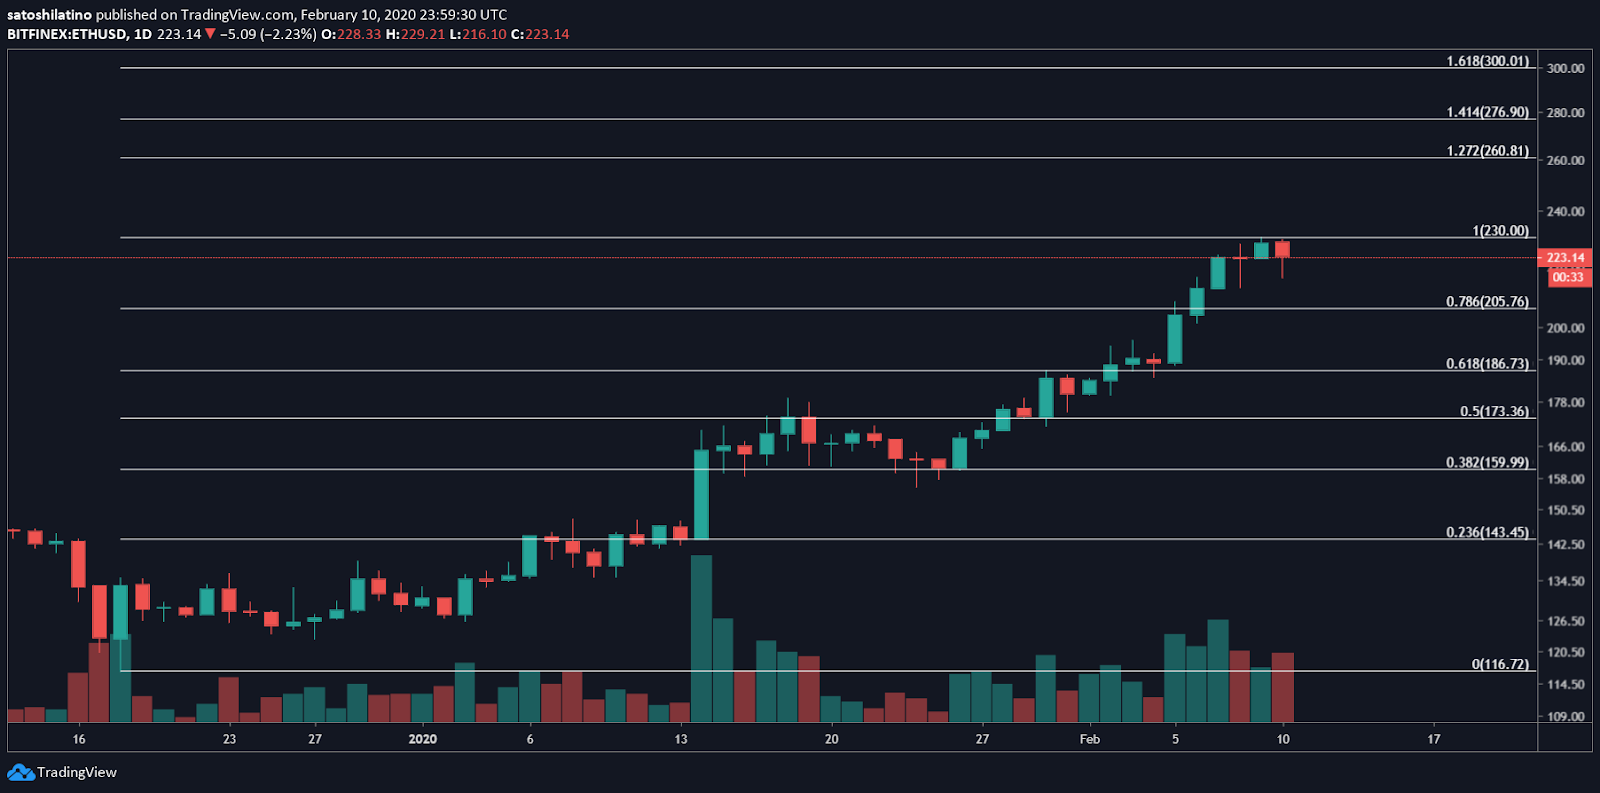
It is worth noting that investors appear to be buying every swing low. Therefore, the bullish outlook cannot be voided despite the bearish signs. If Ethereum is able to break above the recent high of $230, the next level of resistance is given by the 127.2% Fibonacci retracement level, which sits at $261.
Given the trend of rising altcoin dominance, a test of this higher support level could very well be the case.
Time will tell whether sideliners will be presented with an opportunity to re-enter the market or if the bulls will remain in control of Ethereum, pushing its price into new yearly highs.
