 Earn with Nexo

Ethereum Price Analysis ETH / USD: Look For Signs
The $199.00 breakout is key for an ETH rally.
- Ethereum has a bullish short-term trading bias, but remains bearish over the medium-term
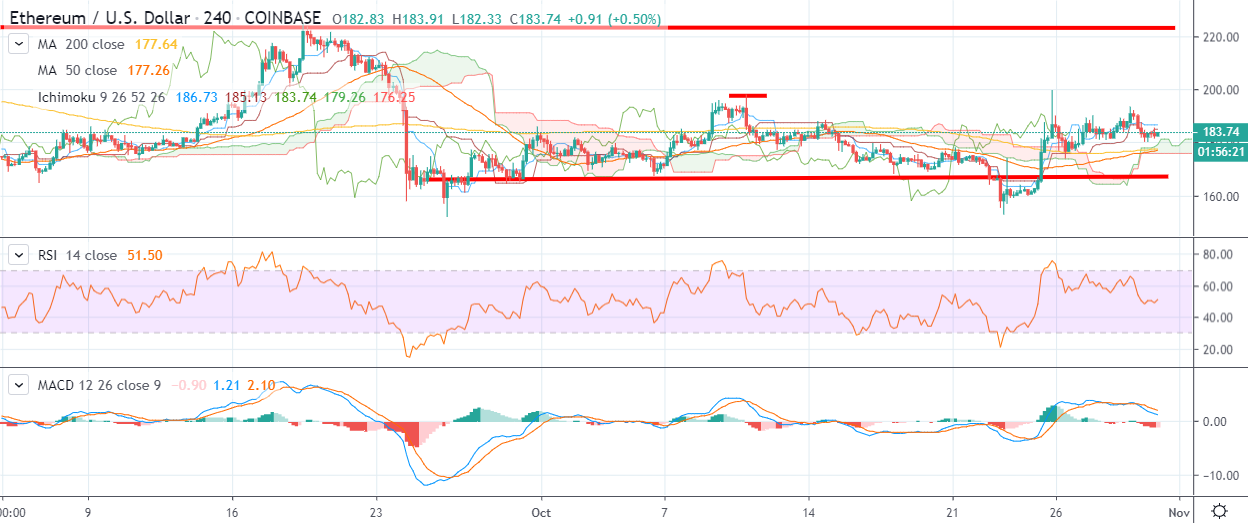
- The four-hour time frame shows that a bearish head and shoulders pattern has been invalidated
- The daily time frame shows bulls need to rally price towards the $240.00 level to ignite a large bullish pattern
Ethereum is consolidating above the $180.00 level after the second largest cryptocurrency by market capitalization pulled back from just below the $200.00 resistance level earlier this week.
Last week’s powerful rally has helped to secure the short-term prospects for the ETH / USD pair, with the cryptocurrency moving above all its key short-term moving averages for the first time since early October.
The ETH / USD pair continues to hold onto trading gains of around ten percent from last week, leaving the cryptocurrency around 1% above its October monthly price open.
Going forward, short-term technical analysis highlights that a bearish head and shoulders pattern with a $40.00 downside projection was invalidated during last week’s rally.
Furthermore, the invalidation target of the bearish head and shoulders pattern would take the ETH / USD towards the $240.00 level. Buyers now need to hold price above the $199.00 resistance level to trigger the next leg higher in the ETH / USD pair.
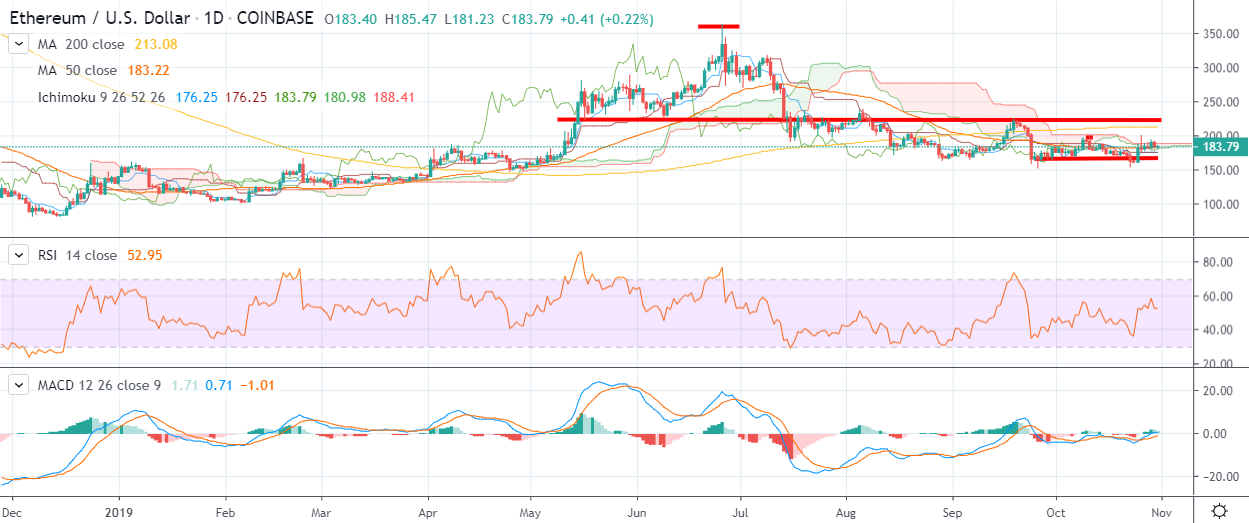
The daily time frame highlights that buyers need to move price above the $210.00 resistance level to change the medium-term outlook towards the ETH / USD pair.
The mentioned time frame also highlights the $240.00 level as technically important. A move towards the $240.00 level would help to form a bullish inverted head and shoulders pattern on the daily time frame, with an upside target that would take the ETH / USD pair towards the $360.00 level.
Looking at the downside, it is entirely possible that a sustainable price floor is now in place around the $152.00 level. A double-bottom pattern was also formed during last week’s decline and sharp rebound.
Both time frames show that a sustained move below the $166.00 level would be extremely bearish for the ETH / USD pair, and could expose another technical test towards the $152.00 level.
According to the latest sentiment data from TheTIE.io, the short-term sentiment towards Ethereum is neutral, at 50.00 %, while the overall long-term sentiment towards the cryptocurrency is also neutral, at 45.00%.
Upside Potential
The four-hour time frame shows that a bearish head and shoulders pattern with an upside target of around $40.00 has now been invalidated. Key upcoming resistance is now located at the $194.00 and $199.00 level.
Key resistance for the ETH / USD pair on the daily time frame is currently located at the $210.00 and $240.00. Both time frames highlight the importance of the $240.00 level.
Downside Potential
The four-hour time frame is showing that the $175.00 level is providing the strongest form of short-term technical support below the pivotal $180.00 level.
The daily time frame highlights that a break under the $166.00 level would be bearish for the ETH / USD pair and may expose a deeper decline back towards the $152.00 level.
Summary
Ethereum could stage a powerful upside rally if buyers can perform a sustained technical breakout above the $199.00 resistance level.
Long-term analysis highlights that a breakout above the $240.00 could propel the ETH / USD pair toward the $360.00 level.
Check out our introductory guide to Ethereum.