Lambda Price Analysis LAMB / USD: Enclosure Breakout
LAMB performed a successful upward breakout.
- Lambda has a neutral short-term bias, with cryptocurrency testing towards key technical resistance on the four-hour time frame
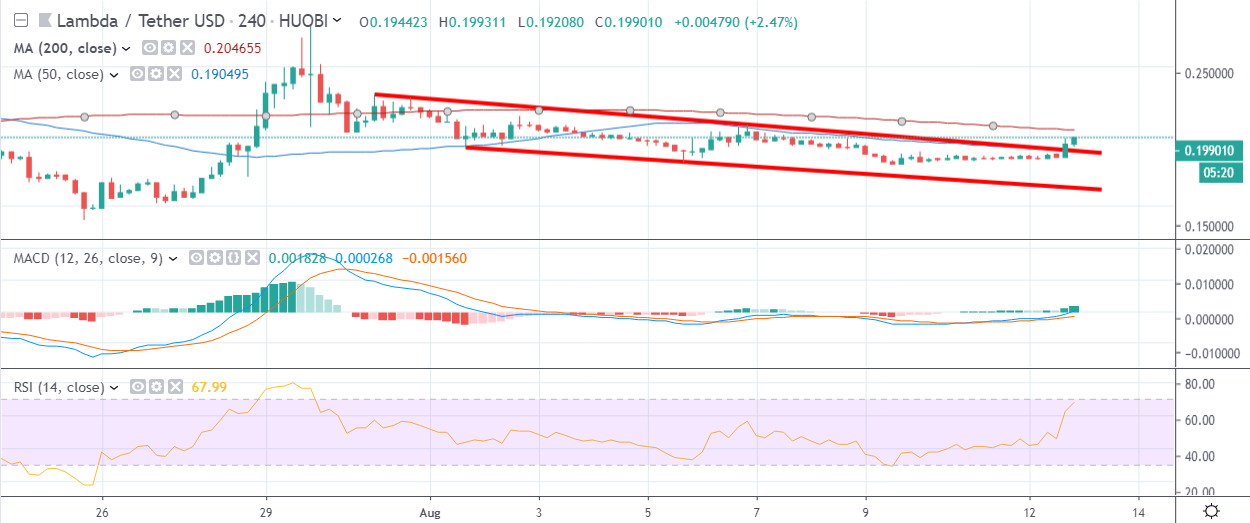
- The four-hour time frame shows that a bullish breakout is underway from descending price channel
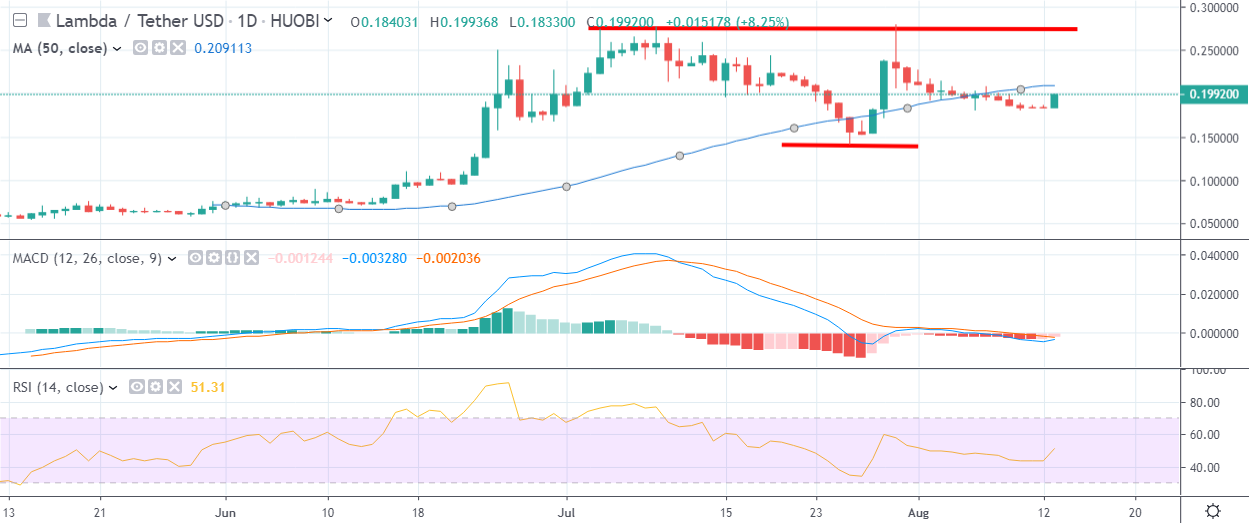
- The daily time frame continues to show a large inverted head and shoulders pattern
Lambda / USD Short-term price analysis
Lambda has a neutral short-term bias, with the cryptocurrency testing back towards its 200-period moving average on the four-hour time frame.
The four-hour time frame shows that the LAMB / USD pair is currently on the rise, following a strong upside breakout from the descending price channel.
Technical indicators are bullish on the four-hour time frame and continue to issue strong buy signals.

Pattern Watch
Traders should note that the upside projection of the recent channel breakout would take the LAMB / USD pair back towards its current monthly trading high.
Relative Strength Index
The Relative Strength Index on the four-hour time frame is bullish, although it is approaching overbought territory.
MACD Indicator
The MACD indicator on the four-hour time frame is bullish and continues to generate a strong buy signal.
Lambda / USD Medium-term price analysis
Lambda has a neutral medium-term bias, with the LAMB / USD pair still consolidating around its 50-day moving average.
The daily time frame is still showing a large inverted head and shoulders pattern, that remains very much in play. Bulls now need to forge a sustainable rally above the LAMB / USD pair’s 50-day moving average to encourage a rally towards neckline resistance.
Technical indicators on the daily time are attempting to move higher, although they remain technically bearish.

Pattern Watch
Traders should note that a complex inverted head and shoulders pattern may be developing on the daily time frame.
Relative Strength Index
The RSI indicator is attempting to turn bullish on the daily time frame, although it remains technically bullish.
MACD Indicator
The MACD indicator is neutral on the daily time frame and is currently failing to generate a clear trading signal.
Conclusion
Lambda has staged an impressive breakout on the four-hour time frame, which may provoke a technical rally towards the current monthly trading high.
The daily time frame continues to highlight that the LAMB / USD pair has substantial upside potential if buyers can ignite the powerful inverted head and shoulders pattern.
