Photo by Noah Berger
Litecoin Price Analysis: Bearish Pattern Is Forming
Litecoin has recovered from its dip below $30.00, and seems to be building up momentum. Will it last?

Powered by Gloria
[vc_row][vc_column][vc_column_text]
- Litecoin attempting to recover short-term bullish momentum following a short-lived dip below the $30.00 level
- The $33.00 levels offers immediate resistance
- Bearish pattern formation seen across various time frames
LTC / USD Short-term price analysis
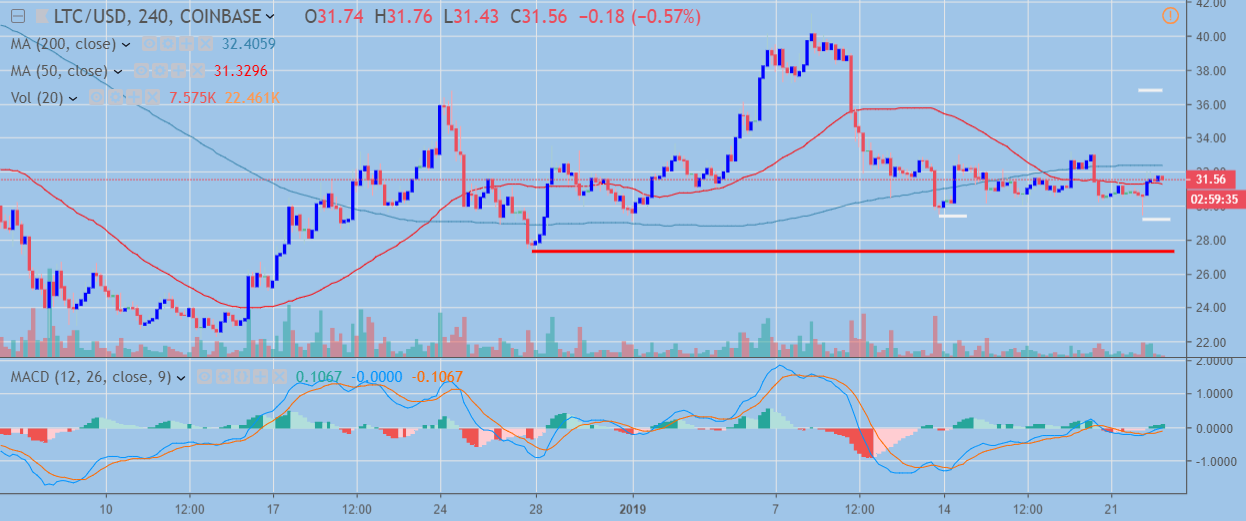
In the short-term, Litecoin is attempting to recover higher after a bullish triple-bottom pattern formed following LTC / USD sellers’ failure to breach the $27.00 support level.
If we see a sustained moved above the $33.00 level over the coming sessions, buyers may target the $40.00 and essentially try to negate the bearish head and shoulders pattern seen across the lower time frames.
The $36.80 level offers a solid resistance barrier prior to the $40.00 level.
Overall, caution is advised as the head and shoulders pattern formation is still in very much in play across the lower time frame chart.
Pattern Watch
If traders observe closely, a smaller head and shoulders pattern can be seen inside the larger head and shoulders pattern across the lower time frame, underscoring the importance of the $33.00 to $0.3400 price range.
Key Moving Averages
Price is tentatively trading above the 50 period moving average on the four-hour time frame, while the 200-period moving average still offers considerable resistance above.
MACD
The MACD indicator is trading in positive territory, which is largely consistent with recent price action. The sharp recovery over the last few sessions has been on increased trading volumes, although trading volume is now weak as the price starts to consolidate.
LTC / USD Medium-term price analysis
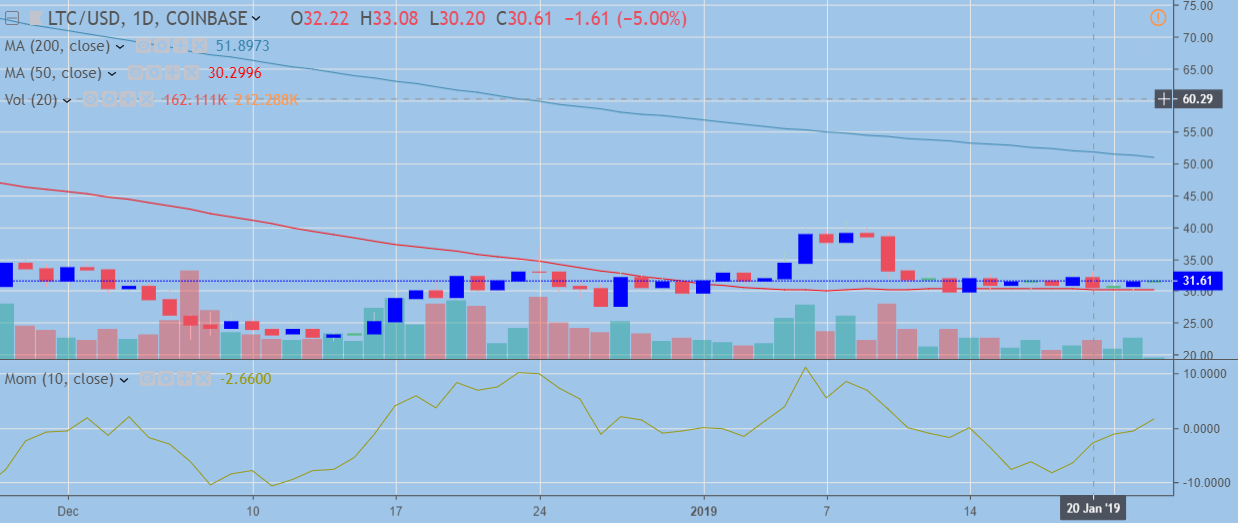
In the medium-term, Litecoin is technically bearish as price is trading well below the pair’s 200-day moving average. Price is also consolidating above its 50-day moving average, while bullish momentum behind the LTC / USD pair continues to grow on the daily time frame, an eventual attack towards the $40.00 level may occur at some stage.
The clear standout on the daily chart is how close price has remained to the December trading low, since November’s mighty drop from the $56.00 area. Also a bearish head and shoulders pattern looks to be shaping up on the daily time frame.
Until the $40.00 level is broken, the LTC / USD pair offers few reasons to be bullish at present.
(LTC / USD Daily Chart. Source: TradingView)
Pattern Watch
The potential formation of a bearish head and shoulder pattern currently offers the most striking visual impact when looking at the LTC/USD pair on the daily time frame.
Moving Averages + Volume
Short-term bullishness currently seen above the 50-day moving average remains inconclusive, while price is still decidedly far away from its trend defining 200-day moving average.
Overall trading volumes appear to be close to the worst levels of 2019 so far.
[/vc_column_text][/vc_column][/vc_row][vc_row][vc_column][vc_column_text][/vc_column_text][/vc_column][/vc_row][vc_row][vc_column][vc_column_text]
Decentral Media, Inc., the publisher of Crypto Briefing, is not an investment advisor and does not offer or provide investment advice or other financial advice. Nothing on this website constitutes, or should be relied on as, investment advice or financial advice of any kind. Specifically, none of the information on this website constitutes, or should be relied on as, a suggestion, offer, or other solicitation to engage in, or refrain from engaging in, any purchase, sale, or any other any investment-related activity with respect to any transaction. You should never make an investment decision on an investment based solely on the information on our website, and you should never interpret or otherwise rely on any of the information on this website as investment advice. We strongly recommend that you consult a licensed investment advisor or other qualified financial professional if you are seeking investment advice on an investment.
[/vc_column_text][/vc_column][/vc_row]


