Matic Price Analysis MATIC / USD: Pumped Up, Not Dumped On
Matic managed to recover significantly from a short-term dip, proving that the bullish sentiment is here to stay.
- Matic Network has a bullish short-term trading bias and continues to advance above its 50-period moving average on the four-hour time frame
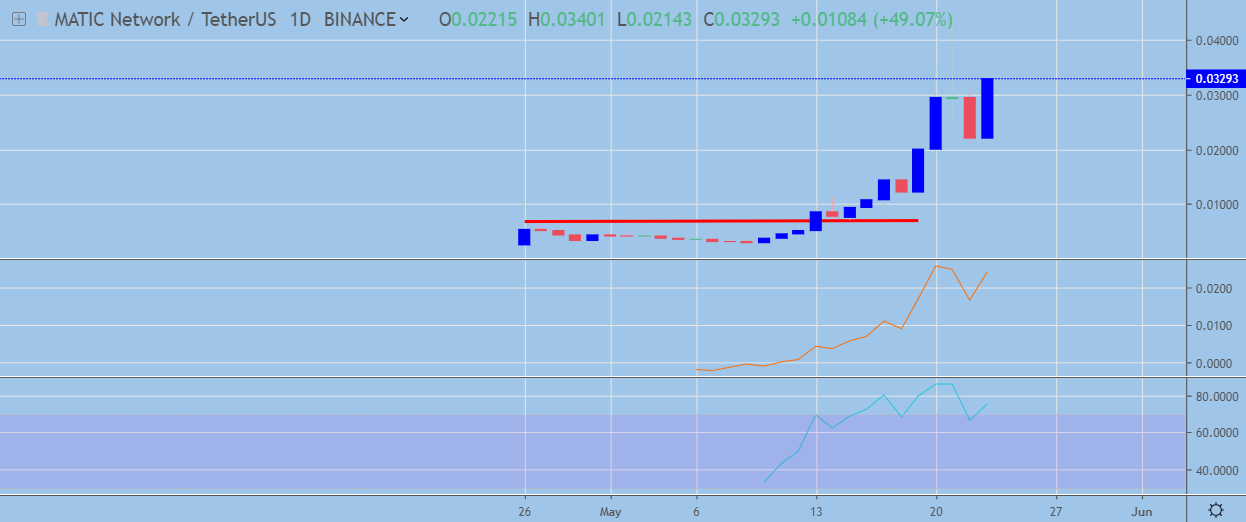
- The daily chart is showing that the cryptocurrency is making fresh all-time highs
- Technical indicators point to further upside ahead for Matic Network
Matic / USD Short-term price analysis
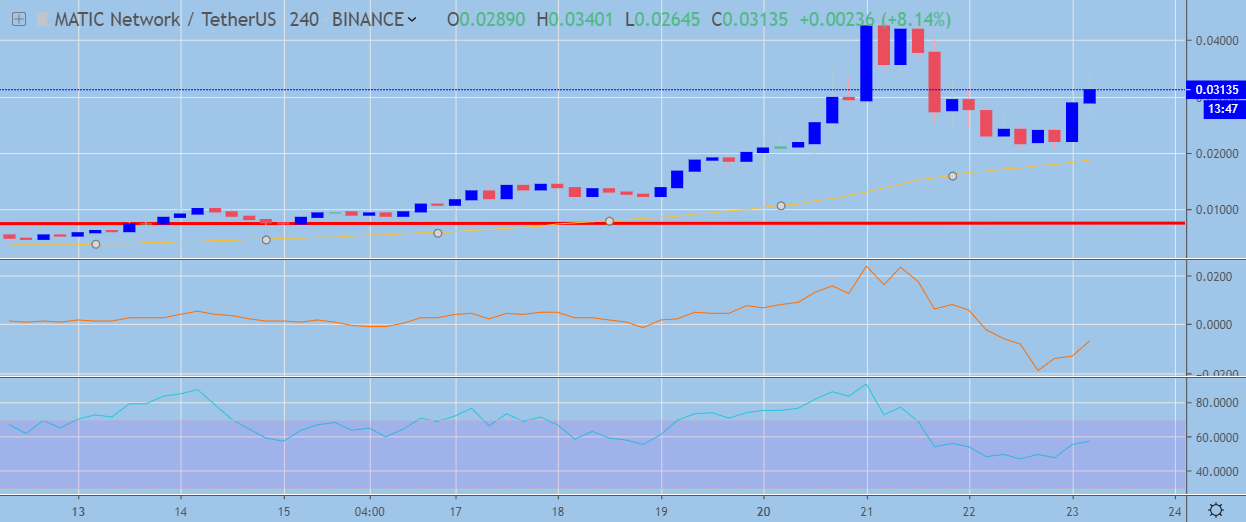
Matic Network has a bullish short-term trading bias, with the cryptocurrency gaining strength above its 50-period moving average on the four-hour time frame.
The four-hour time frame is showing that a potential head and shoulders pattern may be in the process of forming if buyers fail to break the current monthly trading high.
Technical indicators on the four-hour time frame are turning higher and point to further upside ahead for Matic Network.

Pattern Watch
Traders should note that a bullish inverted head and shoulders pattern could form on the four-hour time frame if buyers move the cryptocurrency above the current monthly trading high.
Relative Strength Index
The RSI indicator on the four-hour time frame is bullish, highlighting the growing short-term buying pressure.
Momentum Indicator
The momentum indicator on the four-hour time frame is rising, although it has yet to turn bullish.
Fundamental Analysis
The Matic Network token has surged dramatically over the past several days, with no clear trigger, although a partnership with fellow Binance Launchpad project Celer has been announced.
However, the coin is among the first Binance IEO projects, possibly benefiting from the fabled “Binance effect”.
Moreover, in the past month, the project has announced that Coinbase Ventures is one of its seed investors. This provoked rumors of a Coinbase listing and attracted additional buyers.
Matic / USD Medium-term price analysis
Matic Network has a bullish medium-term outlook, with the cryptocurrency continuing to enjoy solid buying demand on any moves lower.
The daily time frame shows that a bullish technical breakout has been underway since the inverted head and shoulders pattern was triggered earlier this month.
Technical indicators on the daily time frame are bullish, although they are starting to appear overstretched.

Pattern Watch
Traders should monitor the cryptocurrency for signs of possible upside exhaustion if price fails to make new higher highs on the daily time frame.
Relative Strength Index
The RSI indicator on the daily time frame is bullish, although it is approaching overbought conditions.
Momentum Indicator
The momentum indicator on the daily time frame is bullish, although it has moved into extremely oversold territory.
Fundamental Analysis
Medium-term prospects for the project will depend highly on its ability to follow the roadmap and release developments in a timely manner. The project plans its mainnet for August 2019, which can have a positive effect on the price prior to the release.
Conclusion
Matic Network has staged an impressive recovery, further highlighting the present strong demand for the cryptocurrency.
Buyers must continue to make new higher highs across the four-hour and daily time frame or a potential bearish reversal pattern could be triggered over the short-term.
