Polygon, Fantom Poised for Significant Price Action
Polygon and Fantom appear to be gaining traction for significant price movement.

Key Takeaways
- MATIC has risen more than 13% over the weekend.
- Meanwhile, FTM has retraced roughly 4.4%.
- Both tokens look to continue trending in the opposite direction.
Share this article
Polygon’s MATIC and Fantom’s FTM have shown a negative correlation coefficient over the weekend. The former appears to be bound for higher highs, while the latter could be about to enter a steep correction.
Polygon and Fantom Ready for Volatility
Volatility has struck the cryptocurrency market, and altcoins like MATIC and FTM look poised for significant price movement.
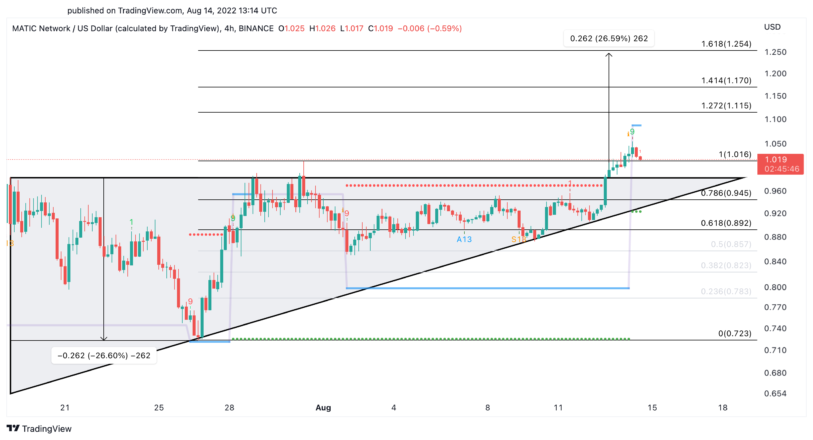
MATIC has enjoyed impressive bullish momentum, surging nearly 13% since the start of Saturday’s trading session. The upswing allowed it to break out of an ascending triangle that developed in its four-hour chart in late July. Further buying pressure could help Polygon enter a 27% uptrend toward $1.25 based on the height of the pattern’s Y-axis.
Still, the Tom DeMark (TD) Sequential indicator presented a sell signal within the same time frame. The bearish formation developed as a green nine candlestick, indicative of a one- to four-candlestick correction. A spike in profit-taking could result in a downswing to $0.98 or $0.95 before the continuation of the uptrend.
Unlike MATIC, Fantom has undergone a 4.4% correction since the start of Saturday’s trading session. The downswing was caused by a rejection from the upper trendline of an ascending wedge developing on FTM’s four-hour chart. This consolidation pattern prevails that if prices close below the lower trendline at $0.38, a 17.5% downswing to $0.32 becomes imminent.
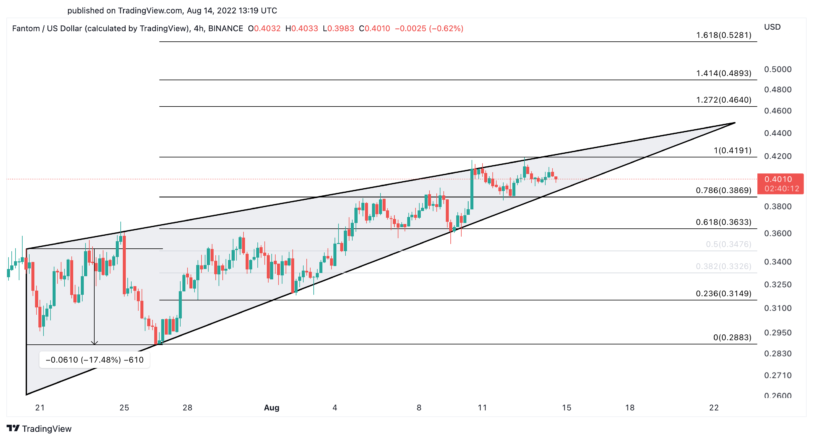
It is worth noting that Fantom would have to close decisively above $0.42 to invalidate the pessimistic outlook. Slicing through this resistance barrier could be seen as a sign of strength that encourages sidelined traders to re-open long positions, triggering a breakout to $0.49 or even $0.53.
Disclosure: At the time of writing, the author of this piece owned BTC and ETH.
Share this article
