Technicals and On-Chain Metrics Spell Trouble for Ethereum
Whales appear to be exiting their ETH positions as uncertainty continues to reign over the cryptocurrency market.
Despite the recent gains Ethereum has posted, different technical and on-chain metrics spell trouble. A further spike in Ether’s selling pressure may be significant enough for it to resume the downtrend seen through September.
A Further Downturn on Ethereum’s Horizon
Ethereum has been trying to regain some ground after the 37% nosedive it took at the beginning of the month.
Yet, the 50-twelve-hour moving average has managed to contain rising prices at bay. Each time the smart contracts giant has managed to surge towards this resistance level, it gets rejected, and a steep correction follows.
Recently, Ether faced another significant rejection from this critical hurdle. After surging to a high of $368.5 on Sept. 28, prices retraced to close below the 50-twelve-hour moving average. Meanwhile, the TD sequential presented a sell signal in the form of a green nine candlestick, suggesting further losses on the horizon.
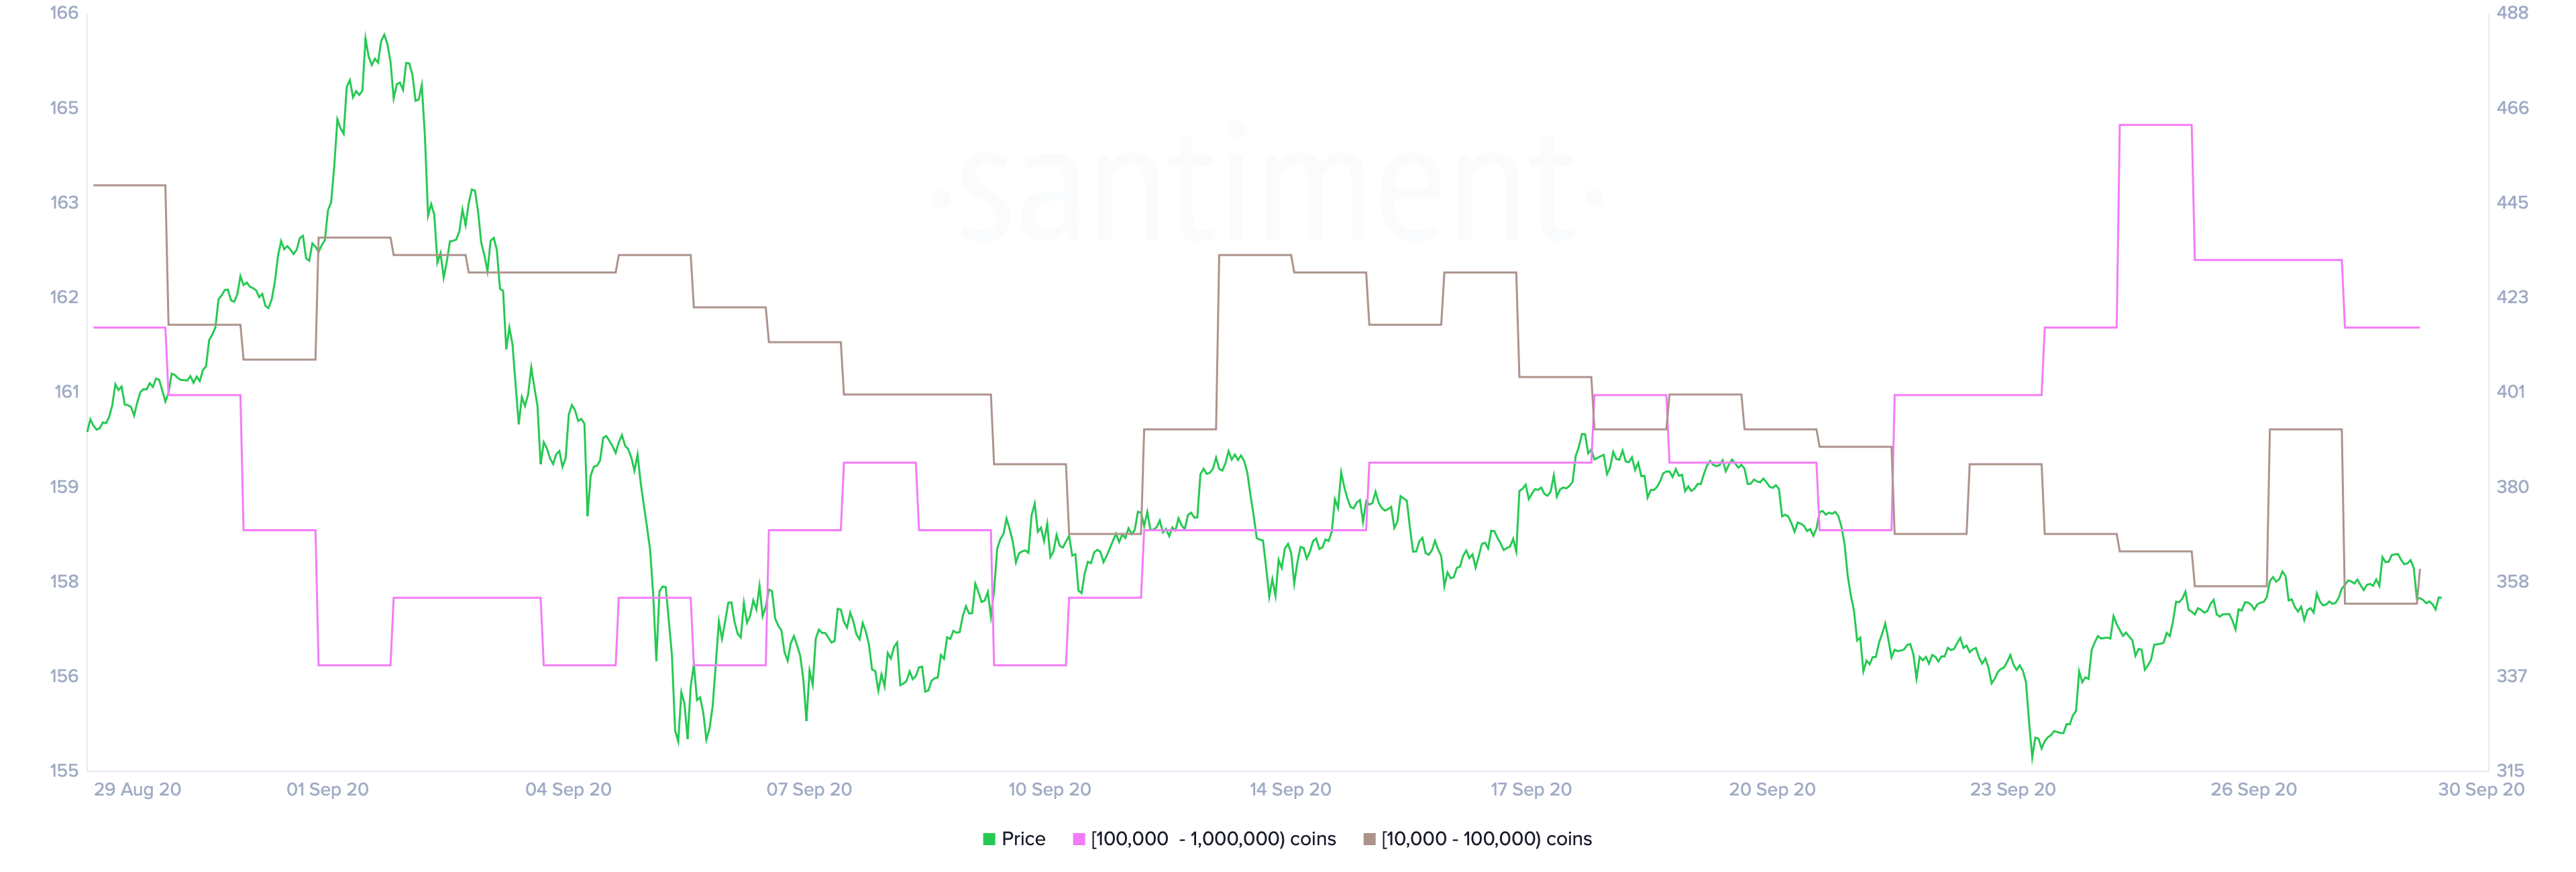
Santiment’s holder distribution adds credence to the pessimistic outlook. This on-chain metric recorded a significant decline in the number of addresses with millions of dollars in Ethereum, colloquially known as “whales.”
Since Sept. 25, the number of addresses holding 10,000 to 1 million ETH has been dropping steadily. Roughly 13 whales have left the network or redistributed their tokens since then, representing a 1.2% drop in just a few days. When considering that these big investors hold between $3.6 million and $360 million in ETH, the spike in selling pressure can translate into slumping prices.

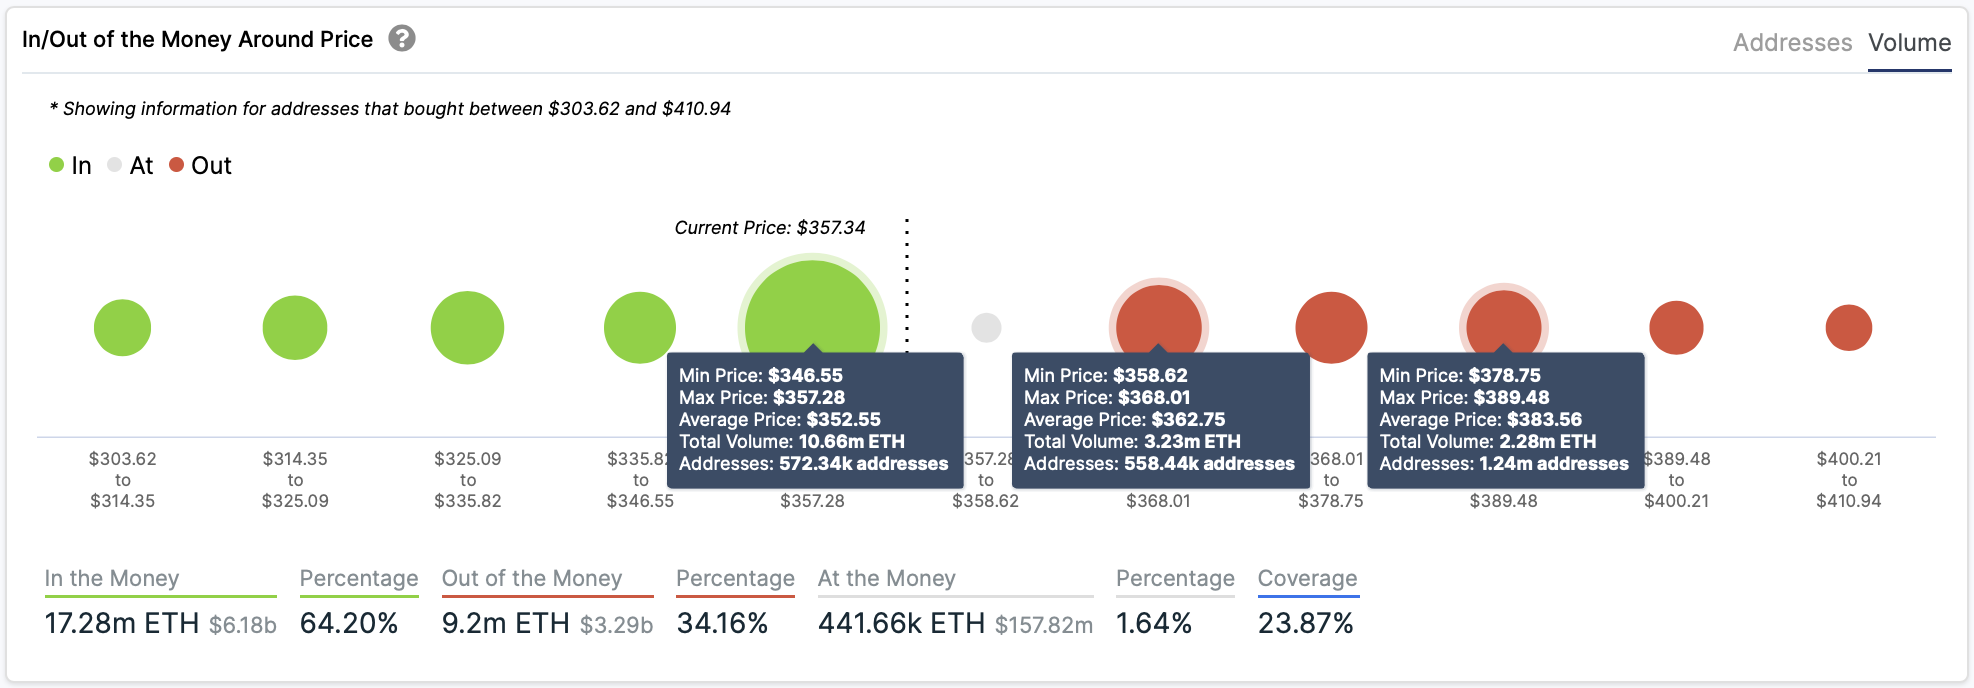
Nonetheless, IntoTheBlock’s “In/Out of the Money Around Price” (IOMAP) model suggests that Ethereum sits on top of a massive supply barrier. Based on this on-chain metric, roughly 572,000 addresses had previously purchased 10.7 million ETH between $347 and $357.
In the event of a correction, this considerable support area may have the ability to hold prices from declining further. Holders within this price range would likely try to remain profitable in their long positions. They may even buy more tokens to avoid seeing their investments go into the red.
But if the whales’ selling spree continues, it may have the strength to push Ether below this support wall.
Under such circumstances, the IOMAP cohorts reveal that the next critical hurdle lies between $240 and $300. Here, approximately 5.8 million addresses are holding nearly 11.7 million ETH.

On the flip side, the second-largest cryptocurrency by market capitalization would have to break above the supply barrier that sits at $362 to aim for higher highs.
More importantly, moving past the resistance at $385 would likely have the ability to jeopardize the bearish outlook and allow the Ethereum to rise towards $450.
