TRON / USD Technical Analysis: Contrasting Pictures
TRX / USD Technical Analysis: TRON is bearish in the short-term, but bulls are still winning on the medium-term charts.
[vc_row][vc_column][vc_column_text]
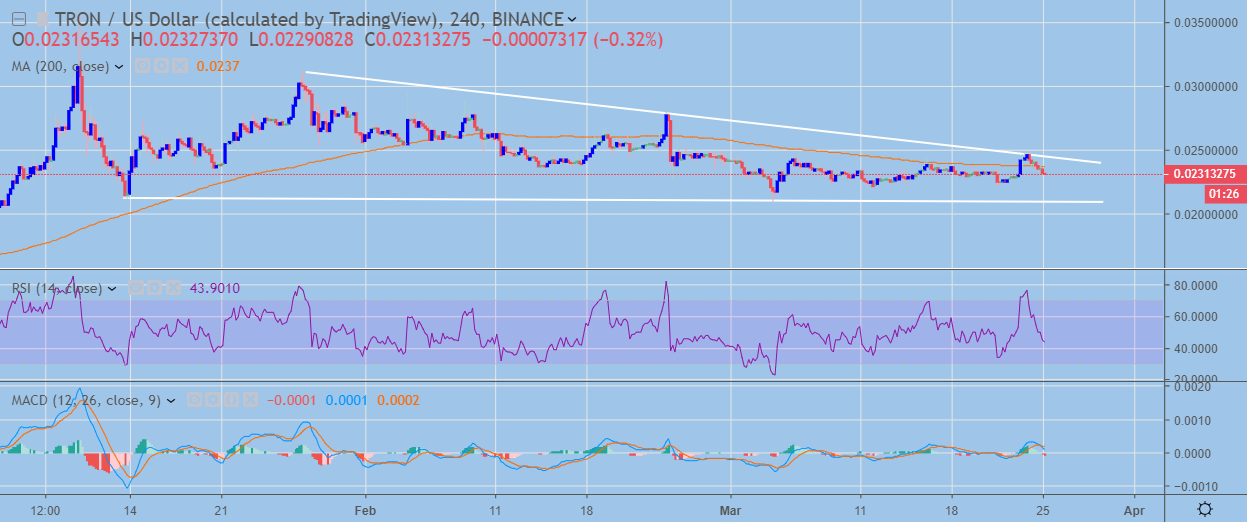
- TRON has turned bearish over the short-term, with the cryptocurrency trading below its 200-period moving average on the four-hour time frame
- The four-hour time frame also shows the TRX / USD pair trading within a descending triangle pattern
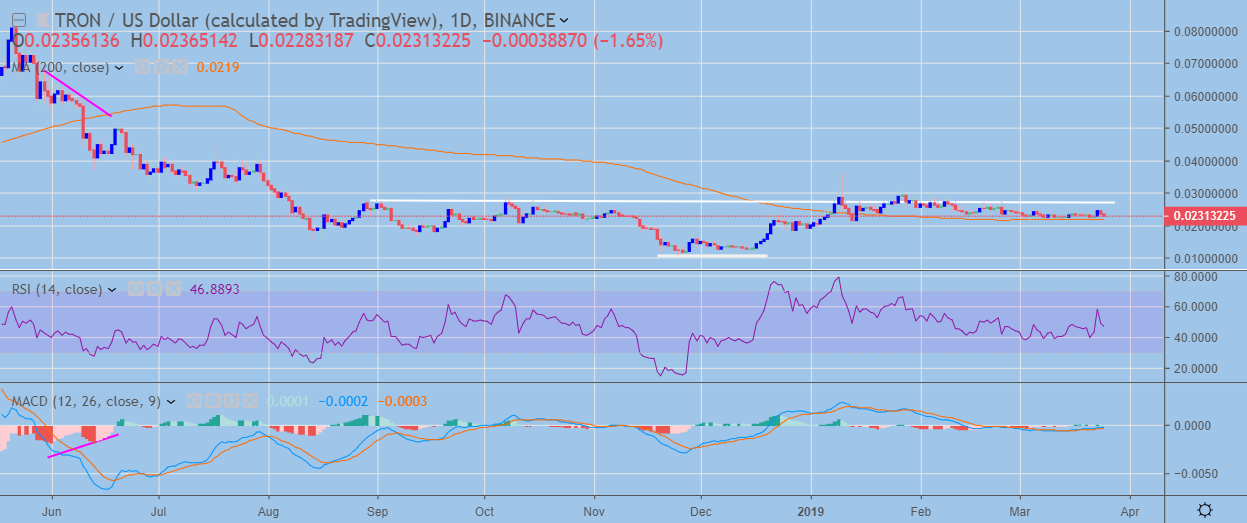
- The TRX / USD pair’s medium-term outlook remains bullish, with the cryptocurrency still holding above its 200-day moving average
TRON / USD Short-term price analysis
TRON has turned bearish in the short-term, with the cryptocurrency once again trading below its 200-period moving average on the four-hour time frame after failing to move above key trendline resistance.
A descending triangle pattern has also formed across the four-hour time frame, with the TRX / USD pair currently trading around the middle of the bearish pattern.
Technical indicators on the four-hour time frame are resoundingly bearish and continue to signal further losses ahead.

Pattern Watch
Traders should note that descending triangle patterns are typically bearish and form during downtrends.
Relative Strength Indicator
The Relative Strength Index has turned bearish on the four-hour time frame and is signaling growing selling pressures.
MACD Indicator
The MACD indicator is currently generating a bearish trading signal on the four-hour time frame, with both the MACD signal line and histogram turning lower.
TRON / USD Medium-term price analysis
TRON remains bullish over the medium-term, with the cryptocurrency still trading above its trend defining 200-day moving average.
The daily time frame continues to show an inverted head and shoulders pattern, with the TRX / USD pair trapped in a period of price consolidation below the neckline of the bullish pattern.
Bullish MACD price divergence is also present on the daily time frame from last year, which if reversed would take the cryptocurrency back towards levels not seen since June last year.

Pattern Watch
Traders should note that the overall upside target of the bullish inverted head and shoulders on the daily time frame would eradicate the bullish MACD divergence on the daily time frame.
Relative Strength Indicator
The RSI indicator remains neutral on the daily time frame, although bearish pressure is building.
MACD Indicator
The MACD indicator is flatlined on the daily time frame and is failing to generate a clear trading signal.
Conclusion
Bearish pressure is growing over the short-term, with the TRX / USD pair edging towards the worst levels of the month so far.
The daily time frame offers a contrasting picture and continues to show a large bullish pattern with strong upside potential.
Ultimately, traders should be mindful that further downside may occur in the near-term, although the medium-term trend remains bullish.
Decentral Media, Inc., the publisher of Crypto Briefing, is not an investment advisor and does not offer or provide investment advice or other financial advice. Nothing on this website constitutes, or should be relied on as, investment advice or financial advice of any kind. Specifically, none of the information on this website constitutes, or should be relied on as, a suggestion, offer, or other solicitation to engage in, or refrain from engaging in, any purchase, sale, or any other any investment-related activity with respect to any transaction. You should never make an investment decision on an investment based solely on the information on our website, and you should never interpret or otherwise rely on any of the information on this website as investment advice. We strongly recommend that you consult a licensed investment advisor or other qualified financial professional if you are seeking investment advice on an investment.
[/vc_column_text][/vc_column][/vc_row]
