VeChain / USD Technical Analysis: Diverging Wedge

Share this article
- VeChain is bearish in the short-term with price starting to break below a descending triangle pattern
- Medium-term picture for VeChain is overwhelmingly bearish
- Bullish MACD divergence is present on the daily time frame
VeChain / USD Short-term price analysis
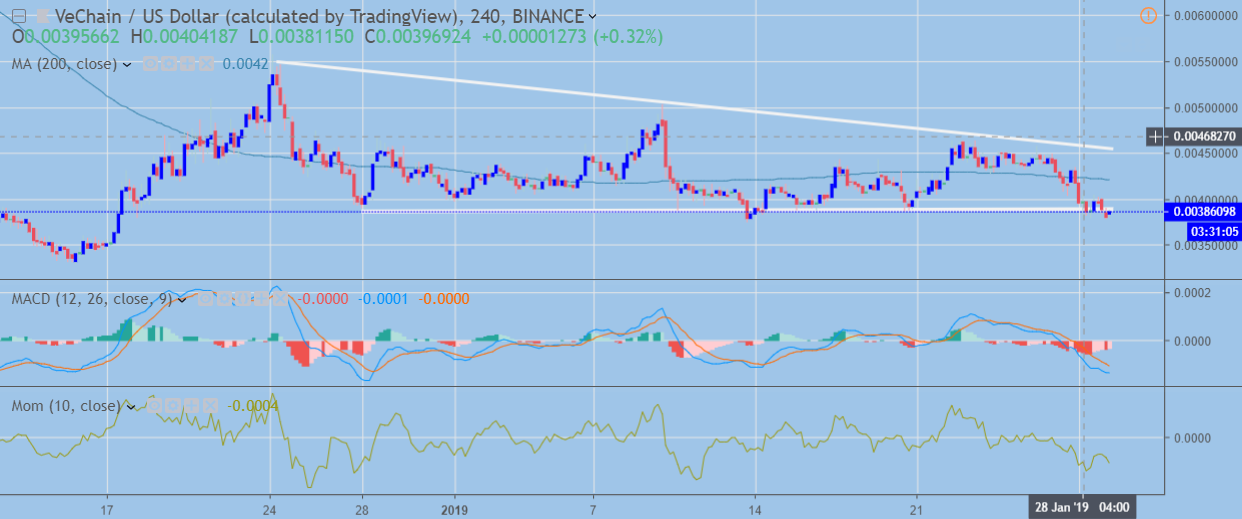
In the short-term, VeChain / USD pair is bearish with price now starting to break below a well-defined descending triangle pattern on the four-hour time frame.
If the VeChain / USD pair continues to decline, an eventual test of its all-time price low would appear the most likely scenario.
It is also worth noting that the recent decline has so far failed to breach the current 2019 trading low. A loss of this key area may trigger the next wave of heavy technical selling.
Pattern Watch
Traders should carefully watch the current breakout underway below the descending wedge pattern on the four-hour time frame.
The January 13th decline below the descending triangle pattern generated a false bearish signal, as buyers rallied price towards the top of the triangle.

VeChain / USD H4 CHART (Source: TradingView)
Key Moving Averages
Price is currently trading well below the pairs 200-period moving average on the four-hour time frame.
MACD & Momentum
The MACD indicator on the four-hour time frame is currently inconclusive and is starting to correct towards neutral territory.
Short-term momentum is tracking lower and is generating bearish signals.
VeChain / USD Medium-term price analysis
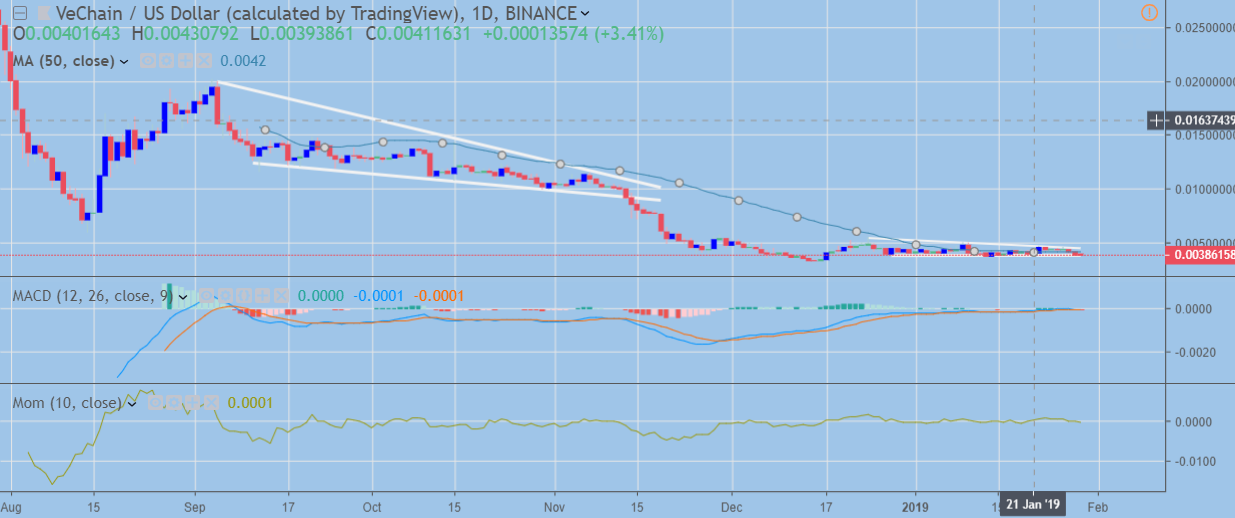
In the medium-term, VeChain is bearish and looks set to challenge its all-time price low, as price continues to sink lower and create bearish lower highs and lower lows.
Interestingly, there is a large amount of bullish divergence present on the daily time frame. This has been present since September of last year and may potentially signal that a reversal could occur in the long-term once a price floor has been established.
It is also worth noting the divergence is present on the Momentum Indicator.

VeChain/USD Daily CHART (Source: TradingView)
Pattern Watch
Price is currently trading in a descending triangle pattern, although a breakout has yet to be confirmed on the daily time frame.
MACD And Momentum
The MACD indicator on the daily time frame is starting to turn bearish, while the Momentum indicator has yet to generate any bearish signals.
Decentral Media, Inc., the publisher of Crypto Briefing, is not an investment advisor and does not offer or provide investment advice or other financial advice. Nothing on this website constitutes, or should be relied on as, investment advice or financial advice of any kind. Specifically, none of the information on this website constitutes, or should be relied on as, a suggestion, offer, or other solicitation to engage in, or refrain from engaging in, any purchase, sale, or any other any investment-related activity with respect to any transaction. You should never make an investment decision on an investment based solely on the information on our website, and you should never interpret or otherwise rely on any of the information on this website as investment advice. We strongly recommend that you consult a licensed investment advisor or other qualified financial professional if you are seeking investment advice on an investment.
