Shutterstock cover by Immersion Imagery
Stellar Token XLM Targets $0.43 After Crucial Breakout
Stellar's XLM token must overcome another crucial supply barrier to confirm the beginning of a new uptrend.
XLM appears to be breaking out after breaching a critical resistance barrier. While volatility is on the rise, investors must be aware of the possibility of a fakeout.
XLM Prepares For High Volatility
Institutional interest seems to be coming back to the cryptocurrency market after a few weeks of low volatility, and XLM is one of the tokens that stands to benefit.
A recent report by Arcane Research reveals that open interest associated with long Bitcoin positions from asset managers has reached a new all-time high of $165.7 million. Such market behavior indicates that large investors have strong conviction that the asset will see further upside.
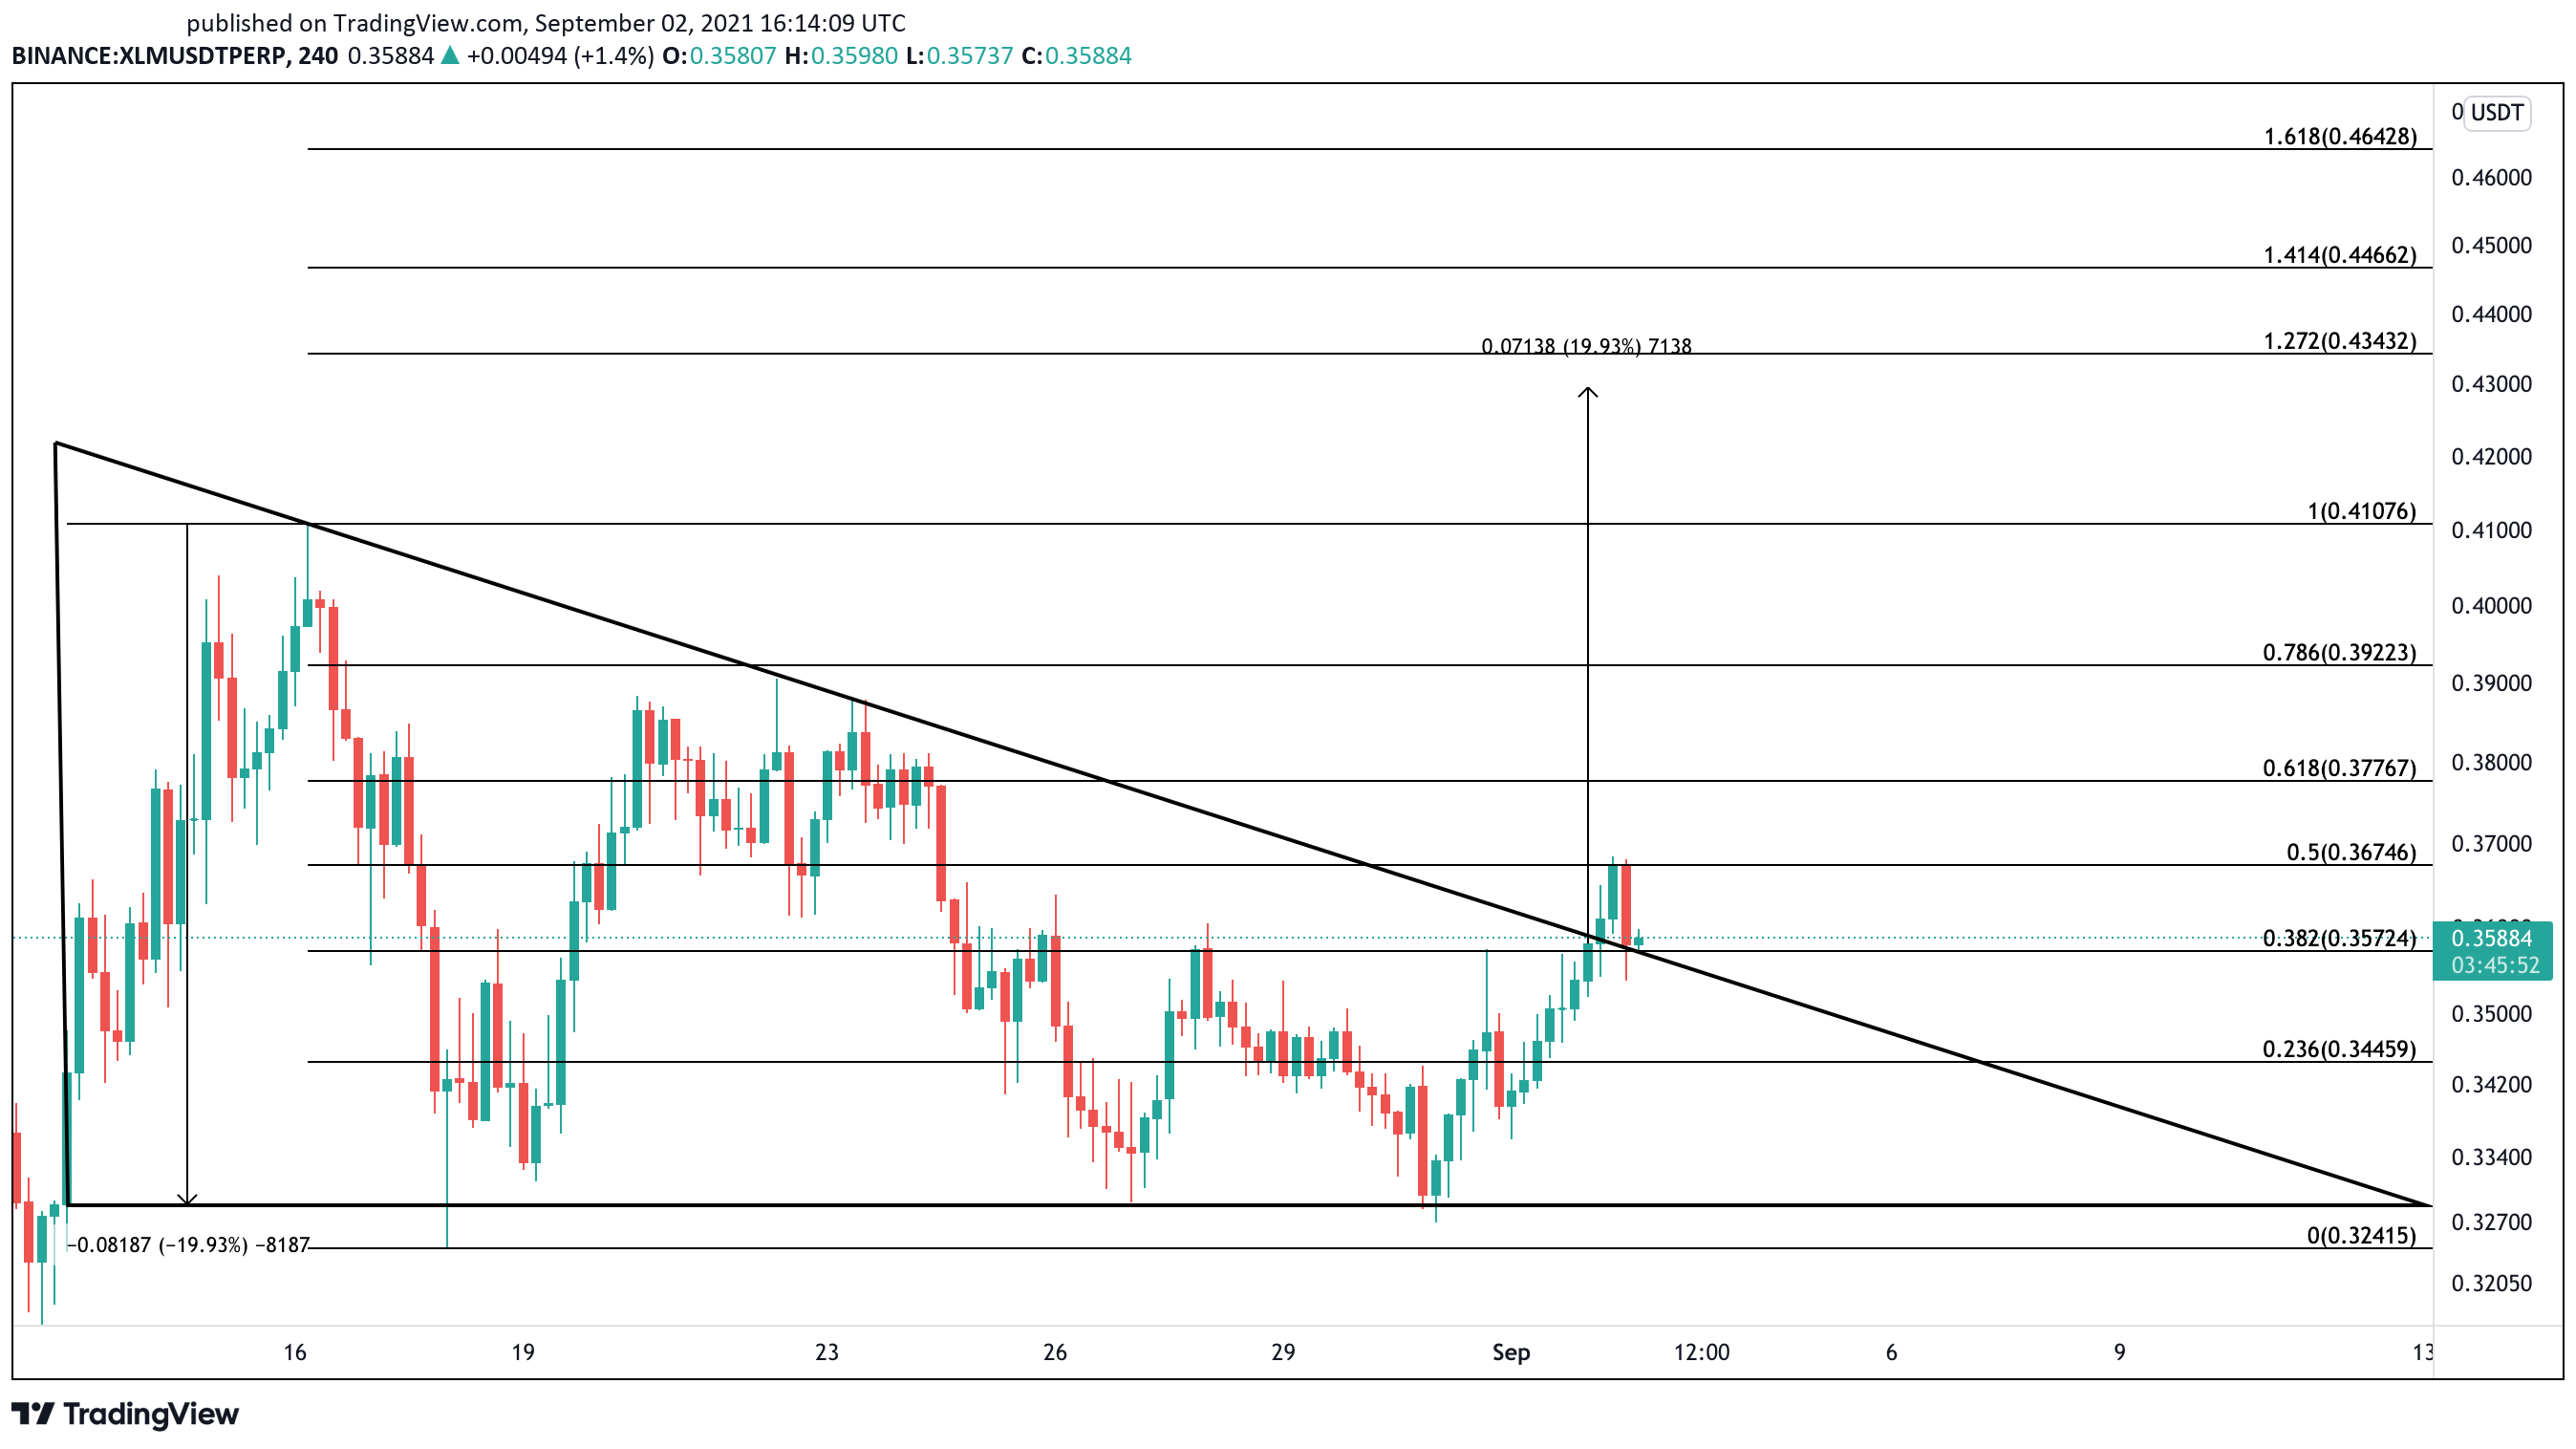
As most digital assets trend higher, Stellar’s XLM token appears ready to resume its uptrend. The cross-border remittances token recently broke out of a descending triangle that had been containing its price action since Aug. 13.
Now that XLM has retested the triangle’s breakout point, an increase in buying pressure around the current price levels could see it rise by nearly 20% towards $0.434. Slicing through the 50% Fibonacci retracement level at $0.367 could serve as another confirmation factor for the optimistic outlook.

It is essential to pay close attention to the 38.2% Fibonacci retracement level at $0.357. Given the increasing volatility, market makers could be setting up a bull trap to liquidate unaware investors.
A decisive four-hour candlestick close below this support level could put a hold on the bullish thesis and result in a pullback to the 23.6% Fibonacci retracement level or the triangle’s x-axis. These support levels sit at $0.345 and $0.329 respectively.
