Shutterstock photo by Volodymyr_Shtun
XRP Gears up for Volatility, Bulls Prime Buys
XRP prices are forming a bullish pattern that could rise above $1.00 despite the coin's legal troubles.
XRP is currently at risk of being deemed a security by the U.S. Securities and Exchange Commission. However, one of the most prominent technical analysts in the industry believes that it may provide an opportunity for speculators to profit.
XRP Price Movement Ahead
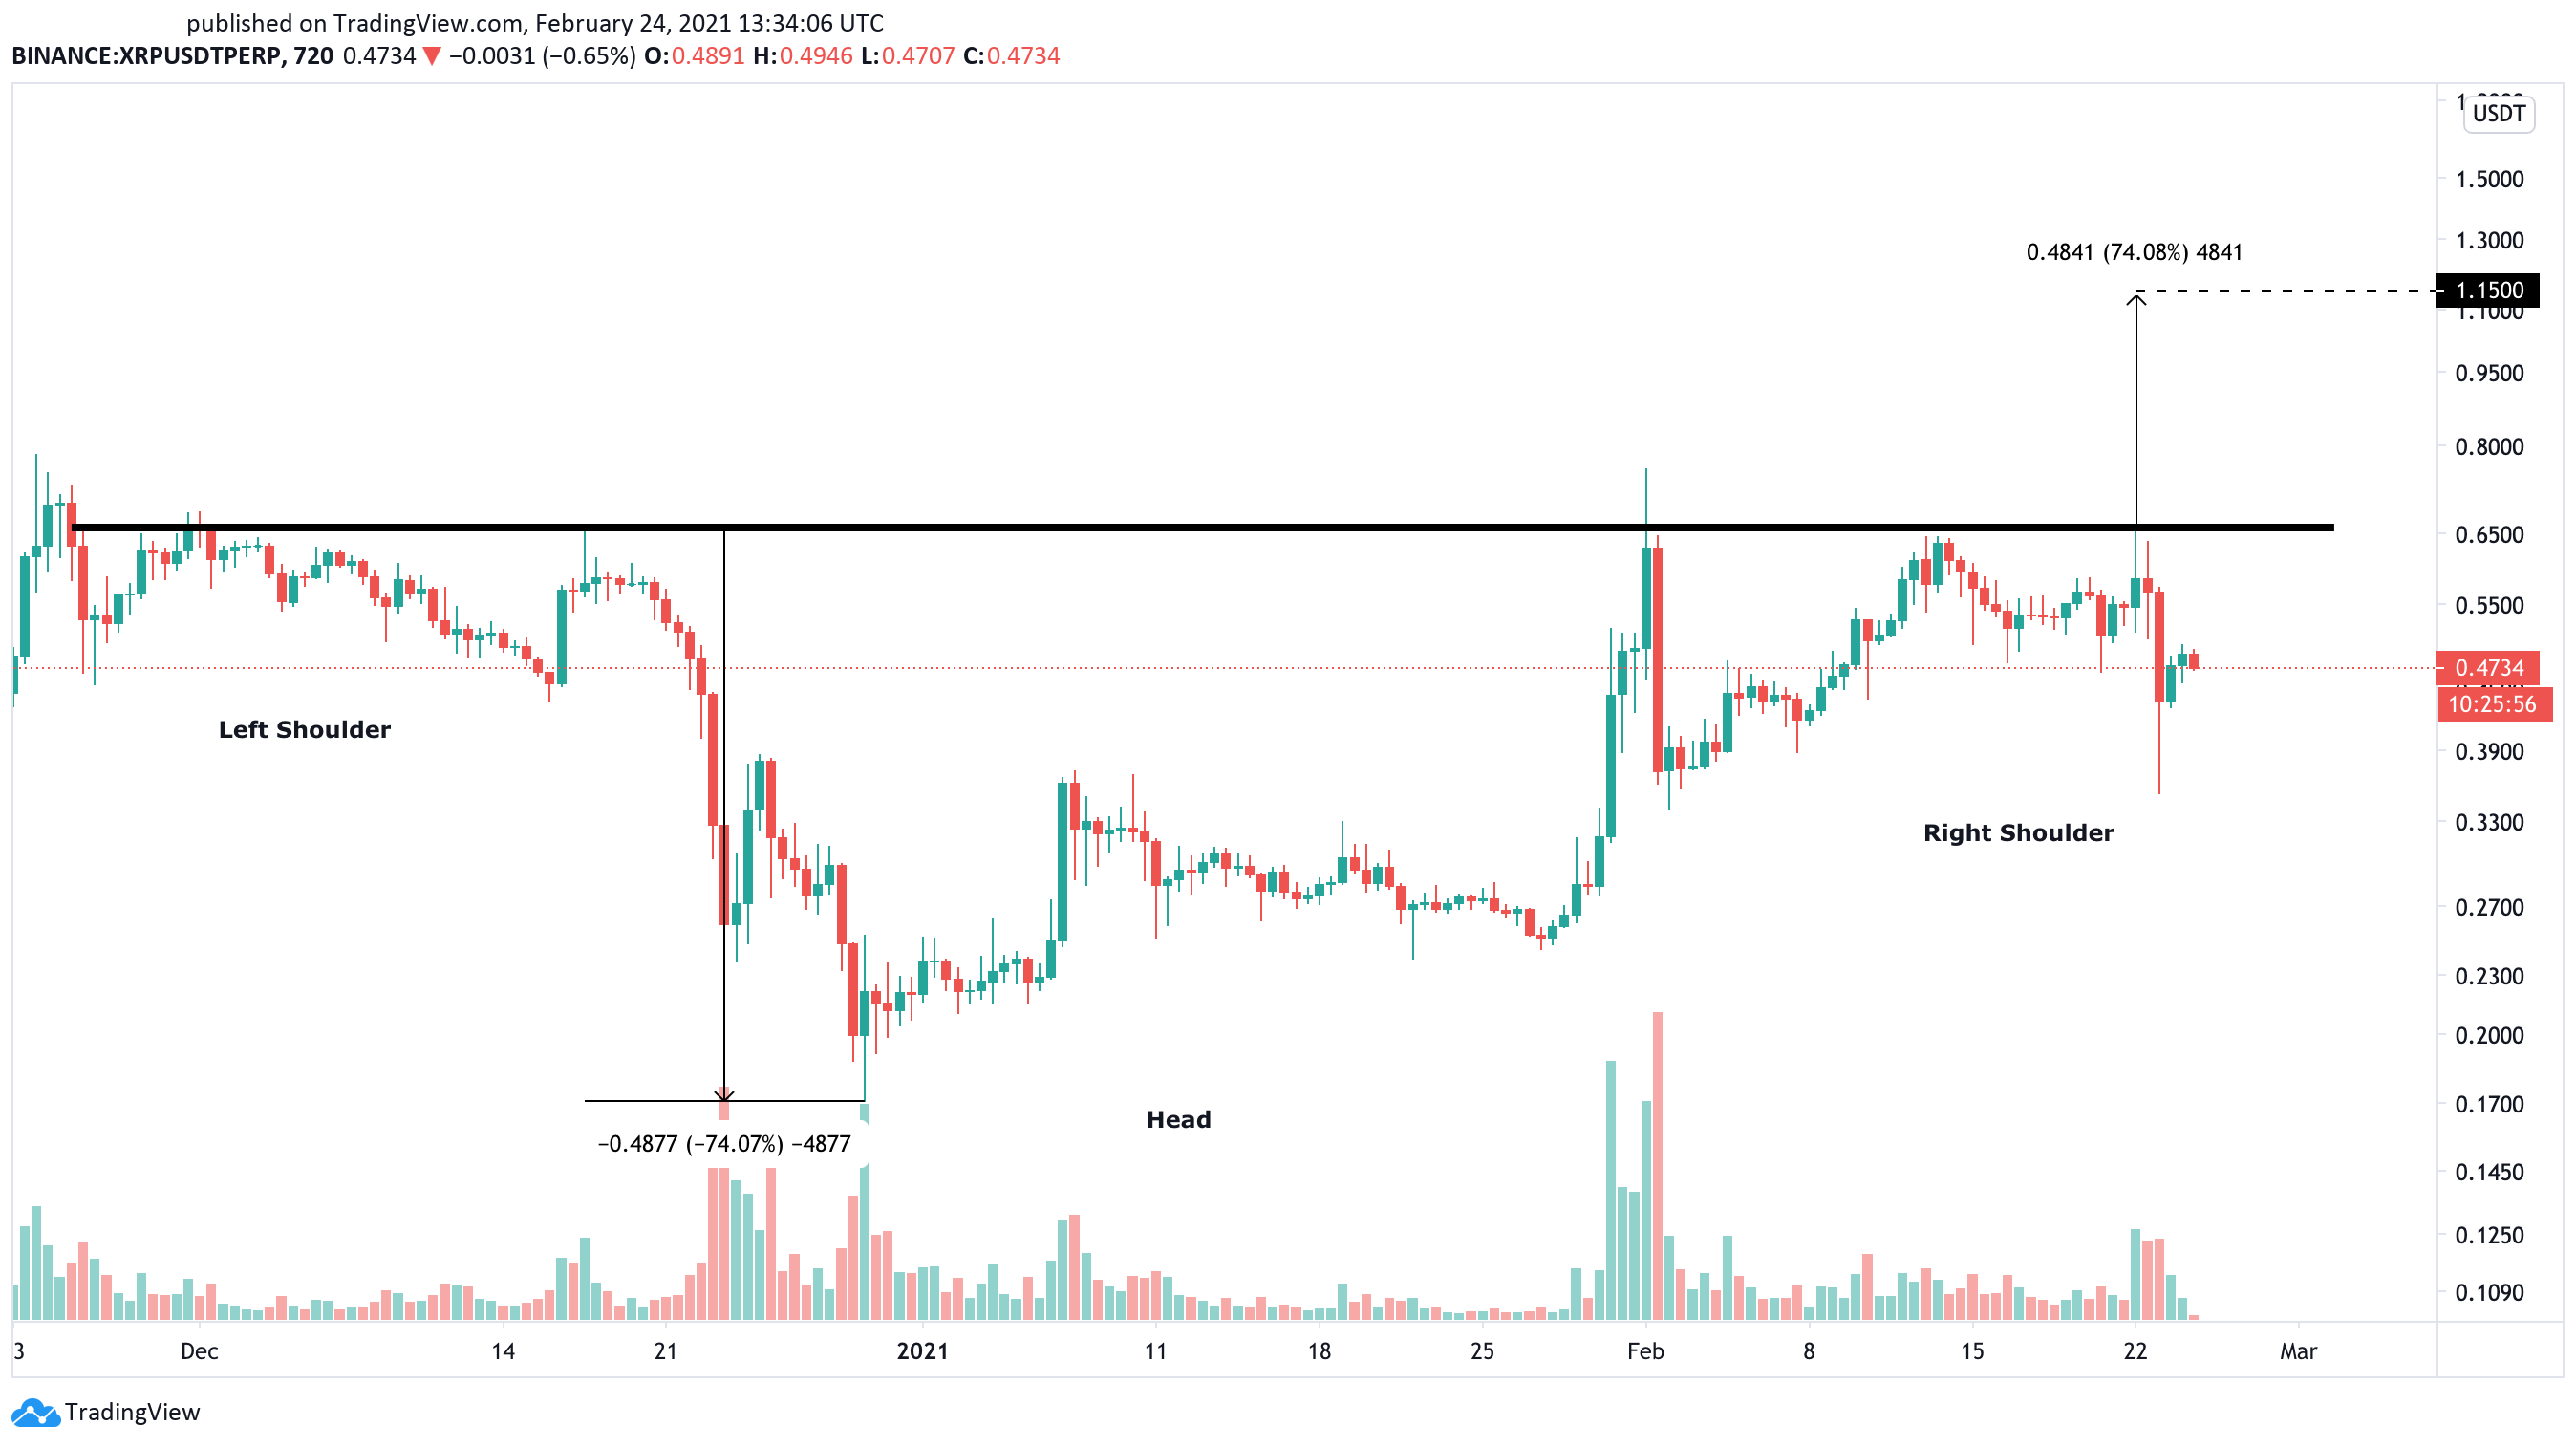
According to 40-year trading veteran Peter Brandt, XRP seems to have developed an inverse head-and-shoulders pattern on its 12-hour chart. The cryptocurrency is currently forming the right shoulder of the bullish formation but has the potential to break out, as this is one of the most reliable trend reversal patterns.
Although Brandt said that he does not trade OTC securities, he emphasized that XRP “would be of interest” if he did invest.
A bullish impulse that allows XRP to close above the pattern’s neckline at $0.66 could lead to a 74% upswing.
XRP could then rise to a new yearly high of $1.15 based on the inverse head-and-shoulders pattern. This optimistic target is determined by measuring the distance between the head and the neckline and adding it upwards from the breakout point.

XRP Must Close Above $0.66
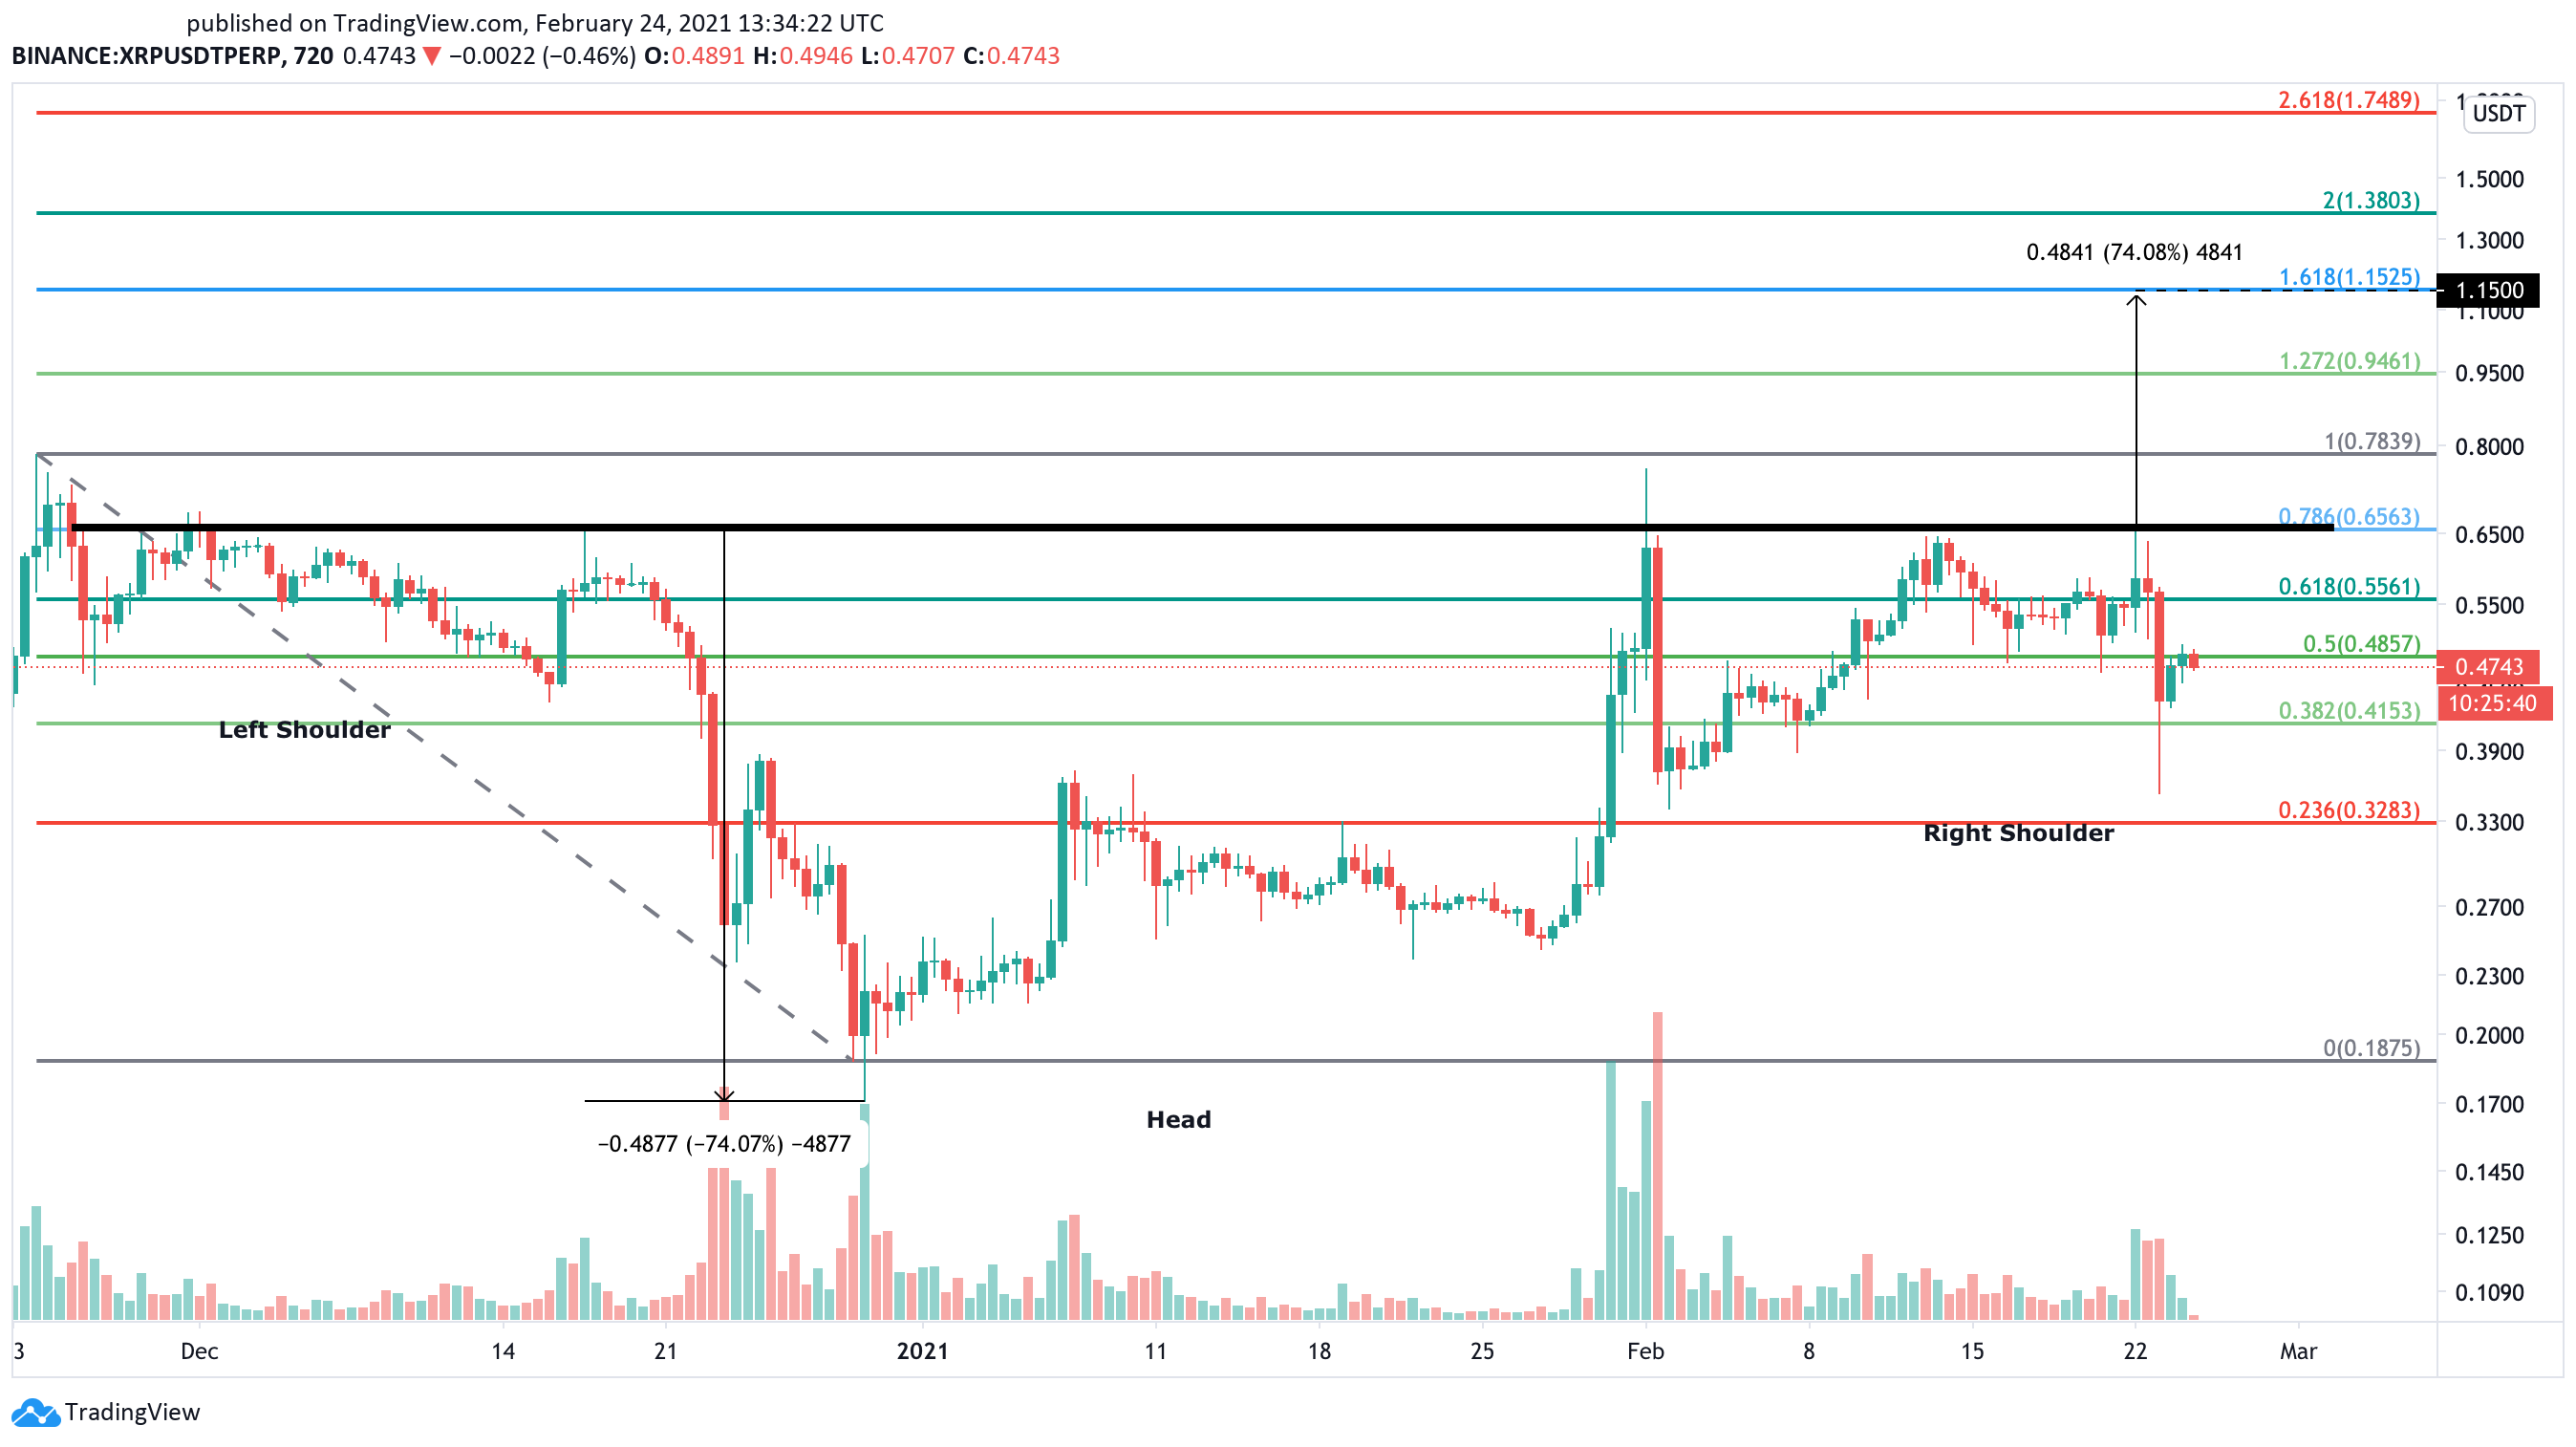
It is worth noting XRP must close decisively above the $0.66 barrier to validate the bullish outlook. If this were to happen, the Fibonacci retracement indicator suggests that XRP would face significant resistance on its way up.
The $0.78 and $0.95 levels will be the most considerable areas of interest that XRP will have to slice through to meet the head-and-shoulders pattern’s target of $1.15.

Traders must wait for a 12-hour candlestick close above the overhead resistance at $0.66 for the inverse head-and-shoulders pattern to be validated. Until that happens, XRP remains at risk of further losses.
A sudden bearish impulse below the $0.41 support level increases the odds for a downswing towards $0.33. Moving past this critical demand wall could invalidate the bullish outlook and lead to a massive correction towards $0.20.
Disclosure: At the time of writing, this author held Bitcoin and Ethereum.
