 Earn with Nexo

Zcash Price Analysis ZEC / USD: As Low As It Can Go?
Technical indicators show signs of recovery.
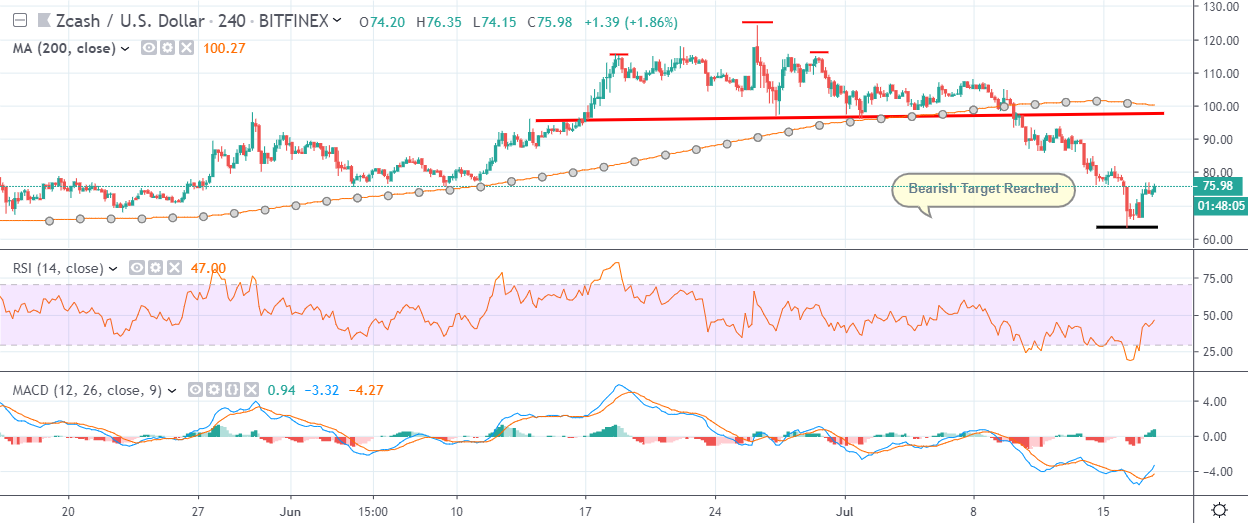
- Zcash has a bearish short-term trading bias, with the cryptocurrency trading at its lowest level since May 2019
- The four-hour time frame shows that a bearish head and shoulders pattern has now reached its full downside projection
- The ZEC / USD pair has also bounced sharply from its key 200-day moving average
Zcash / USD Short-term price analysis
Zcash has a bearish short-term outlook, with the ZEC / USD pair tumbling to its lowest trading level since May this year.
The four-hour time frame shows that a minor bullish reversal is currently underway, after a well-defined bearish head and shoulders pattern reached its overall downside projection.
Technical indicators across the four-hour time are now attempting to turn bullish.
Pattern Watch
Traders should note that the ZEC / USD pair may start to test back towards the neckline of the bearish head and shoulders pattern.
Relative Strength Index
The RSI indicator on the four-hour time frame is attempting to correct higher, although it remains technically bearish.
MACD Indicator
The MACD indicator on the four-hour time frame is turning bullish, with the MACD signal line and histogram issuing a buy signal.
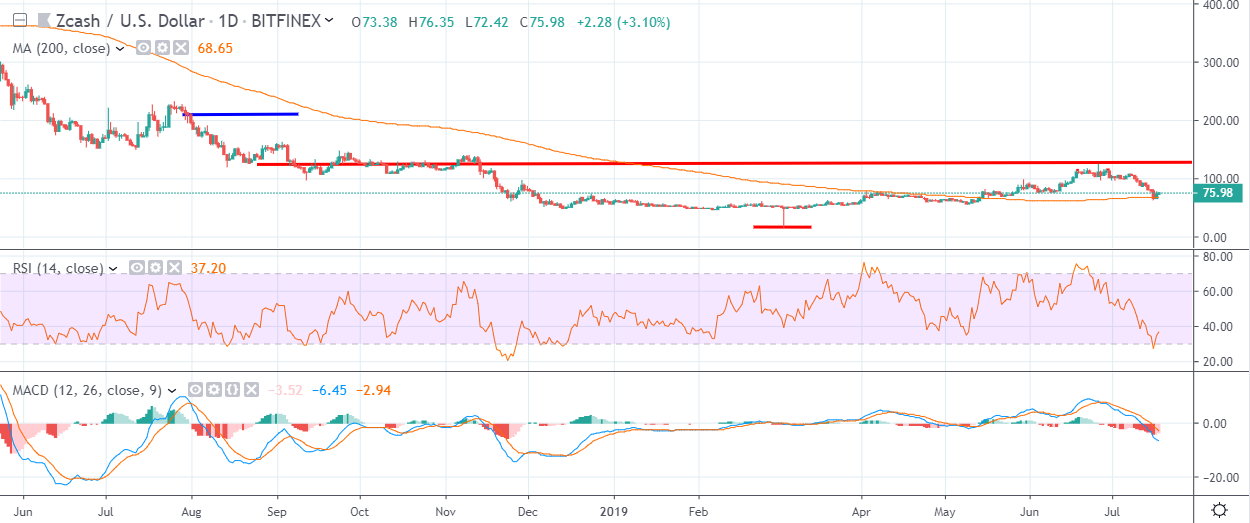
Zcash / USD Medium-term price analysis
ZCash has a bullish medium-term trading bias, with the ZEC / USD pair holding above critical technical support on the daily time frame.
The daily time frame is showing that ZEC / USD bulls successfully defended the pair’s 200-day moving average. The large inverted head and shoulders pattern on the daily time frame remains valid.
Technical indicators on the daily time frame are bearish and continue to issue a sell signal.
Pattern Watch
Traders should note that a complex inverted head and shoulders pattern may be forming on the daily time frame.
Relative Strength Index
The RSI indicator remains bearish on the daily time frame, although it is attempting to correct from oversold conditions.
MACD Indicator
The MACD indicator on the daily frame remains bearish and continues to issue a strong sell signal.
Conclusion
Zcash has undergone a strong reversal after the bearish head and shoulders pattern on the four-hour time frame reached its overall downside projection.
Medium-term ZEC / USD bulls still have the upper hand while price trades above the pair’s 200-day moving average and the large inverted head and shoulders pattern remains technically valid.
Check out our coin guide for Zcash for a quick overview of the project.
A deeper dive is available in our DARE analytical report.