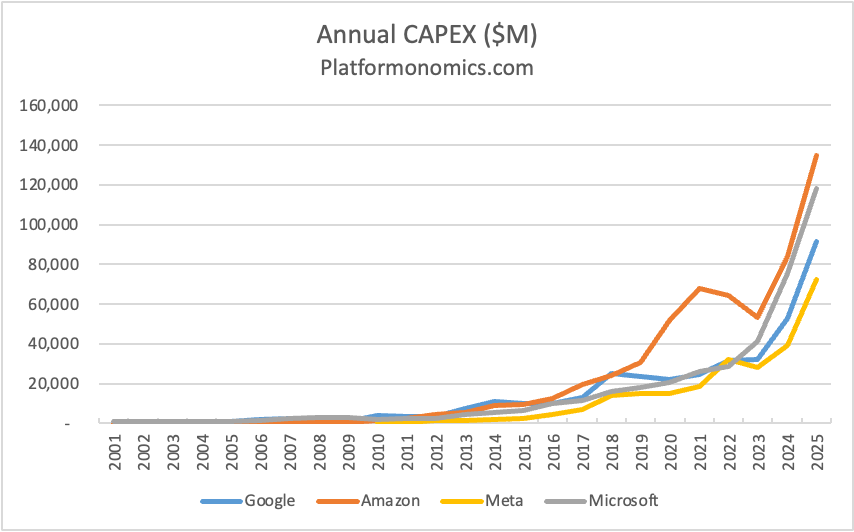
Amazon boosts CAPEX to $44.2B, up from $25B last year
Amazon's quarterly capital spending jumped 77% year-over-year as the tech giant pours billions into AI infrastructure, squeezing free cash flow to near zero.
+12.4% (FY ended 2025-12-31 vs FY ended 2024-12-31) 10-K
Annual net income
77,670,000,000 USD (FY ended 2025-12-31, attributable to the company) 10-K
Annual operating margin
11.2% (FY ended 2025-12-31)
Forward P/E
Unavailable: no dated forecast source
Gloria daily close for session Oct 27, 2026. Market cap and trailing P/E use this close with the SEC share total and trailing diluted earnings, each dated next to its figure. Annual revenue, revenue growth, net income and margin show their own fiscal period and link the 10-K. Current context may postdate this article.
Amazon.com Inc. and its peers
Company
Price
Market cap
P/E (trailing)
Forward P/E
Annual revenue (USD)
Annual revenue growth
Annual net income (USD)
Operating margin
Amazon.com Inc.
AMZN · Price dated Oct 27, 2026 · tokenized AMZNx
21,893,000,000FY ended 2026-01-31, attributable to the company · 10-K
4.2%FY ended 2026-01-31
Missing figures stay unavailable. Forward P/E requires a dated source. Annual revenue, revenue growth, net income and margin come from each company's own 10-K, in US dollars, and each row shows that fiscal year. Revenue growth compares the fiscal year with the prior year stated in the same 10-K. Net income is the full year amount attributable to the company, or available to common stockholders where the filing states only that, or consolidated net income. Each row names its basis. Trailing P/E reads "Not meaningful" when the dated trailing diluted EPS is a loss or zero. An operating margin appears only when the filing states both the operating income and the revenue for the same year.
Sources: SEC filings, Gloria daily closes and CoinGecko. Oldest record refresh: Oct 27, 2026, 7:41 PM EDT. Refresh is not a price or filing date. Each row shows its price date and its annual fiscal period. Peers use industry code and company size, or editorial selection. Market cap multiplies that row price by the company share total the latest SEC filing states for every share class together. Trailing P/E divides it by trailing diluted earnings from SEC filings. Rolled earnings per share are approximate because share counts can change between periods. Both appear only when the SEC data carries its date, so they are estimates at one price date, not synchronized filing valuations. Not investment advice.
Token vs underlying stock
Current comparison for AMZN. Historical observations may postdate this article.
Split-adjusted regular-session stock closes from the existing Gloria shared history, paired only with an observed token price within 45 minutes of 16:00 New York time. Up to 60 matched sessions. No interpolation or missing-date fill. Weekends and known early closes are omitted. Token units are not adjusted for issuer multipliers or dividend treatment. This compares quoted prices, not fair value, executable premiums or arbitrage returns. Solid line: token. Dashed line: stock. Exact quote times and values appear below. Historical observations. Retrieval refers to the token source. Token quote times use UTC. The fixed cohort shows its oldest member fetch.
Amazon token vs Amazon stock: exact source values
Date (UTC)
Token (USD)
Stock close (USD)
Token quote (UTC)
2026-08-04
277.39
277.42
2026-08-04 20:00
2026-08-05
272.84
272.65
2026-08-05 20:00
2026-08-06
272.13
272.26
2026-08-06 20:00
2026-08-07
274.76
274.48
2026-08-07 20:00
2026-08-10
277.96
278.09
2026-08-10 20:00
2026-08-11
272.21
272.27
2026-08-11 20:00
2026-08-12
267.48
267.28
2026-08-12 20:00
2026-08-13
265.07
265.13
2026-08-13 20:00
2026-08-14
262.81
262.65
2026-08-14 20:00
2026-08-17
261.07
261.31
2026-08-17 20:00
2026-08-18
259.40
259.45
2026-08-18 20:00
2026-08-19
265.80
265.84
2026-08-19 20:00
2026-08-20
259.95
260.11
2026-08-20 20:00
2026-08-21
258.73
258.63
2026-08-21 20:00
2026-08-24
262.28
262.07
2026-08-24 20:00
2026-08-25
261.06
261.06
2026-08-25 20:00
2026-08-26
260.32
260.28
2026-08-26 20:00
2026-08-27
256.30
256.26
2026-08-27 20:00
2026-08-28
266.44
266.43
2026-08-28 20:00
2026-08-31
259.63
259.77
2026-08-31 20:00
2026-09-01
254.64
254.92
2026-09-01 20:00
2026-09-02
254.81
254.98
2026-09-02 20:00
2026-09-03
258.83
258.90
2026-09-03 20:00
2026-09-04
258.34
258.51
2026-09-04 20:00
2026-09-08
256.81
256.97
2026-09-08 20:00
2026-09-09
252.24
252.40
2026-09-09 20:00
2026-09-10
251.61
251.89
2026-09-10 20:00
2026-09-11
257.13
256.78
2026-09-11 20:00
2026-09-14
253.68
253.54
2026-09-14 20:00
2026-09-15
248.35
248.42
2026-09-15 20:00
2026-09-16
246.01
245.96
2026-09-16 20:00
2026-09-17
251.35
251.19
2026-09-17 20:00
2026-09-18
253.69
253.71
2026-09-18 20:00
2026-09-21
258.31
258.45
2026-09-21 20:00
2026-09-22
255.06
254.98
2026-09-22 20:00
2026-09-23
249.39
249.27
2026-09-23 20:00
2026-09-24
249.48
249.38
2026-09-24 20:00
2026-09-25
249.71
249.67
2026-09-25 20:00
2026-09-28
246.30
246.15
2026-09-28 20:00
2026-09-29
246.66
246.67
2026-09-29 20:00
2026-09-30
249.53
249.15
2026-09-30 20:00
2026-10-01
248.17
248.23
2026-10-01 20:00
2026-10-02
251.37
251.52
2026-10-02 20:00
2026-10-05
251.43
251.40
2026-10-05 20:00
2026-10-06
256.28
256.29
2026-10-06 20:00
2026-10-07
259.85
259.92
2026-10-07 20:00
2026-10-08
254.31
254.06
2026-10-08 20:00
2026-10-09
262.35
262.43
2026-10-09 20:00
2026-10-12
259.60
259.53
2026-10-12 20:00
2026-10-13
258.72
258.58
2026-10-13 20:00
2026-10-14
253.89
254.08
2026-10-14 20:00
2026-10-15
254.89
254.76
2026-10-15 20:00
2026-10-16
250.16
250.00
2026-10-16 20:00
2026-10-19
262.52
262.45
2026-10-19 20:00
2026-10-20
262.57
262.63
2026-10-20 20:00
2026-10-21
262.57
262.37
2026-10-21 20:00
2026-10-22
250.30
250.38
2026-10-22 20:00
2026-10-23
248.07
248.00
2026-10-23 20:00
2026-10-26
248.95
249.09
2026-10-26 20:00
2026-10-27
253.41
253.10
2026-10-27 20:00
Stock history: Gloria · Retrieved Oct 28, 00:31 UTC. Token history: CoinGecko AMZNx.
Quoted token and share units can have different rights, multipliers and dividend treatment. This is not an executable premium or arbitrage signal.
Amazon just dropped $44.2 billion in a single quarter on capital expenditures. That’s not a typo. The figure represents a 77% increase from the $25 billion the company spent in the same period last year, and it signals that Amazon’s AI spending spree is accelerating, not slowing down.
The numbers behind Amazon’s AI bet
The quarterly figure is eye-catching on its own, but zoom out and the picture gets even more dramatic. Amazon’s trailing twelve-month capex now sits at $147.3 billion, a 67% jump from $88 billion over the prior twelve-month period.
Advertisement
Operating cash flow tells a healthier story, rising 30% to $148.5 billion on a trailing twelve-month basis. Free cash flow, the money left after all that spending, cratered to just $1.2 billion. When your operating cash flow is $148.5 billion and your free cash flow is $1.2 billion, nearly every dollar coming in the door is going right back out.
Why AWS matters more than ever
Amazon Web Services, the company’s cloud computing arm, met revenue expectations for the quarter. AWS is the engine that’s supposed to justify all this spending, and so far, it’s delivering.
The news moving money, markets, and the world—before your day starts.
Daily. Free. Join 34,000+ readers across crypto, finance, and policy.
Analysts have pointed to AWS’s performance and optimistic forward guidance as the key reason the market isn’t punishing Amazon for burning through nearly all its free cash flow. That reasoning has contributed to a measurable reduction in bearish sentiment around Amazon’s stock.
What this means for investors and the broader market
The investment thesis here is straightforward but carries real risk. Amazon is betting that AI infrastructure will be the foundation of its next decade of growth, primarily through AWS. If enterprise demand for AI compute continues to surge, the $147.3 billion in trailing capex starts looking like a moat, not a money pit.
But the free cash flow compression is hard to ignore. At $1.2 billion on a trailing twelve-month basis, any slowdown in AWS revenue growth, any delay in AI monetization, or any macroeconomic headwind that forces enterprise clients to cut cloud budgets makes the math uncomfortable fast.
Disclosure: This article was edited by Editorial Team. For more information on how we create and review content, see our Editorial Policy.
The news moving money, markets, and the world—before your day starts.Daily. Free. Join 34,000+ readers across crypto, finance, and policy.
Free daily briefing
Crypto Briefing Pro
The news about what you hold
Follow your stocks and crypto. Read the news about them from hundreds of publishers in Pro.