 Earn with Nexo

Bitcoin Price Analysis BTC / USD: Bears Going For Broke
The situation is critical, with only one key support left
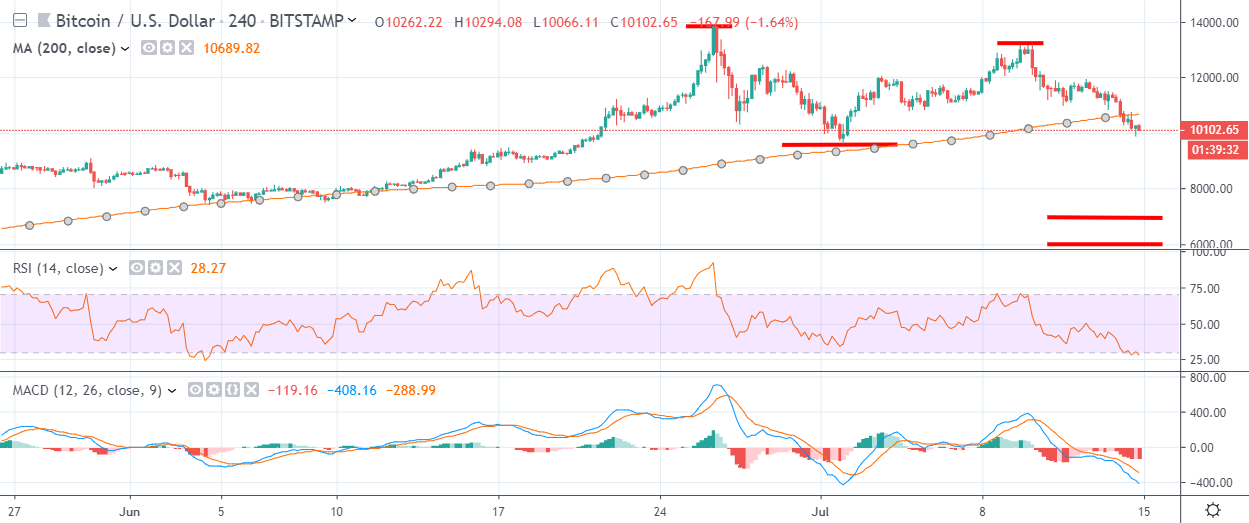
- Bitcoin has a bearish short-term outlook, with the BTC / USD pair trading below its 200-period moving average on the four-hour time frame
- The four-hour time frame shows that bears are close to invalidating an inverted head and shoulders pattern
- The daily time frame shows that the BTC / USD pair could see substantial selling if the $9,650 level is broken
Bitcoin / USD Short-term price analysis
Bitcoin has a bearish short-term trading outlook, with the BTC / USD pair slipping below its 200-period moving average on the four-hour time frame for the first time since early June 2019.
The four-hour time frame is showing that BTC / USD bears are close to invalidating a bullish inverted head and shoulders pattern, following a strong technical rejection from the $12,000 level.
Key short-term technical support is currently located at the $10,000 and $9,650 levels.
Technical indicators on four-hour time frame are bearish and continue to issue strong sell signals.
Pattern Watch
Traders should note that the BTC / USD pair could drop towards the $7,000 support level if the bullish inverted head and shoulders pattern is invalidated.
Relative Strength Index
The Relative Strength indicator on the four-hour time frame is bearish, although it has now reached oversold territory.
MACD Indicator
The MACD indicator on the four-hour time frame is bearish and continues to generate a strong sell signal.
Bitcoin / USD Medium-term price analysis
Bitcoin has a neutral medium-term trading outlook, with the BTC / USD pair undergoing a technical shift on the daily time frame.
The daily time frame is showing sellers are starting to take back control of price action, with the BTC / USD pair unable to make important higher highs. The mentioned time frame is also highlighting that a sustained breach of the current monthly trading low is likely to trigger further heavy selling.
Key upcoming technical support below the current monthly trading low is located at the $8,8000 and $8,000 levels.
Technical indicators on the daily time frame are bearish and show scope for further downside.

Pattern Watch
Traders should note that a bearish double-top pattern formation is currently in play on the daily time frame.
Relative Strength Index
The Relative Strength indicator on the daily time frame has turned bearish and is currently issuing a strong sell signal.
MACD Indicator
The MACD indicator on the daily time frame is bearish, with both the MACD signal line and histogram issuing strong sell signals.
Conclusion
Bitcoin is now under technical selling pressure across both time frames, with the absolutely critical $9,600 level of support to watch over the coming trading sessions.
The breach of the BTC / USD pair’s 200-period moving average on the four-hour time frame is another significant technical development, underscoring that bears are now calling the shots.
Bitcoin was the first of our coin guides, and is also our highest-rated deep research project.