 Earn with Nexo

BCH / USD Price Analysis: Staging Recovery
Bitcoin Cash is on the way to recover above its short-term moving average, though indicators are not decisively bullish.
- BCH has a neutral short-term trading bias, with the BCH / USD pair testing towards its 200-period moving average on the four-hour time frame
- Bullish MACD divergence has now been reversed on the four-hour time frame
- BCH continues to hold price above its 200-day moving average
Bitcoin Cash / USD Short-term price analysis
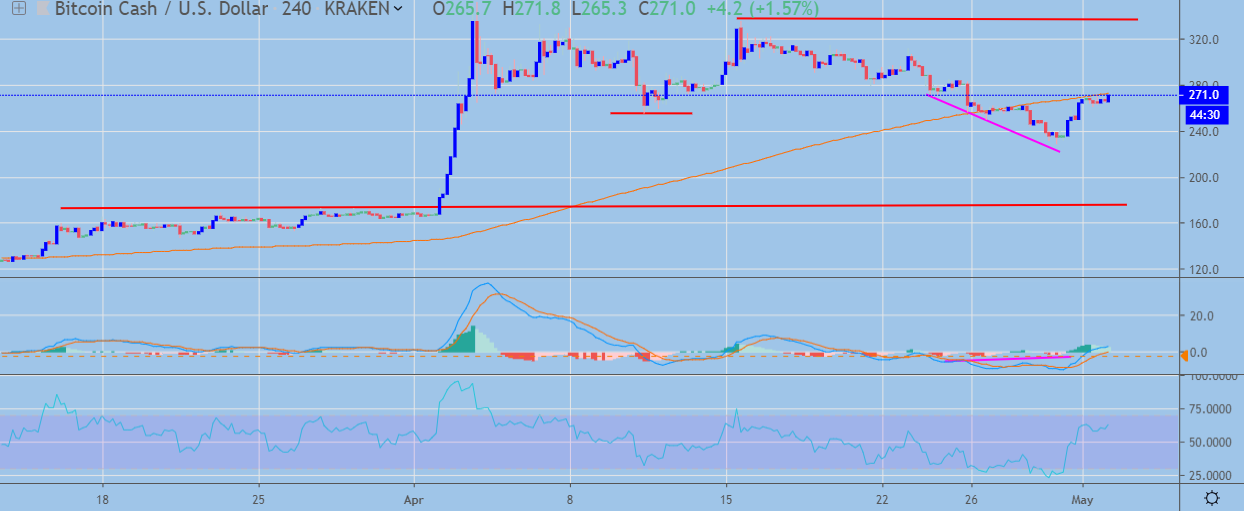
BCH has a neutral short-term trading bias, with the BCH / USD pair now testing towards its 200-period moving average on the four-hour time frame.
The four-hour time frame is currently showing that the BCH / USD pair is attempting to recover from early week losses, while any presence of bullish MACD price divergence has now been eradicated.
Technical indicators on the four-hour time frame are bullish and continue to signal further near-term upside.
 BCH / USD H4 Chart by TradingView
Pattern Watch
Traders should note that a bullish inverted head and shoulders pattern could start to take shape on the four-hour time frame if the recent recovery gathers pace.
Relative Strength Index
The RSI indicator on the four-hour time frame has turned bullish and has scope to move even higher.
MACD Indicator
The MACD indicator on the four-hour time frame is bullish, with the MACD signal line issuing a buy signal.
Fundamental Analysis
BCH has been surging over the past several days. This may be explained by the project’s expected launch of Schnorr Signatures, which should improve on-chain security and privacy.
Bitcoin Cash / USD Medium-term price analysis
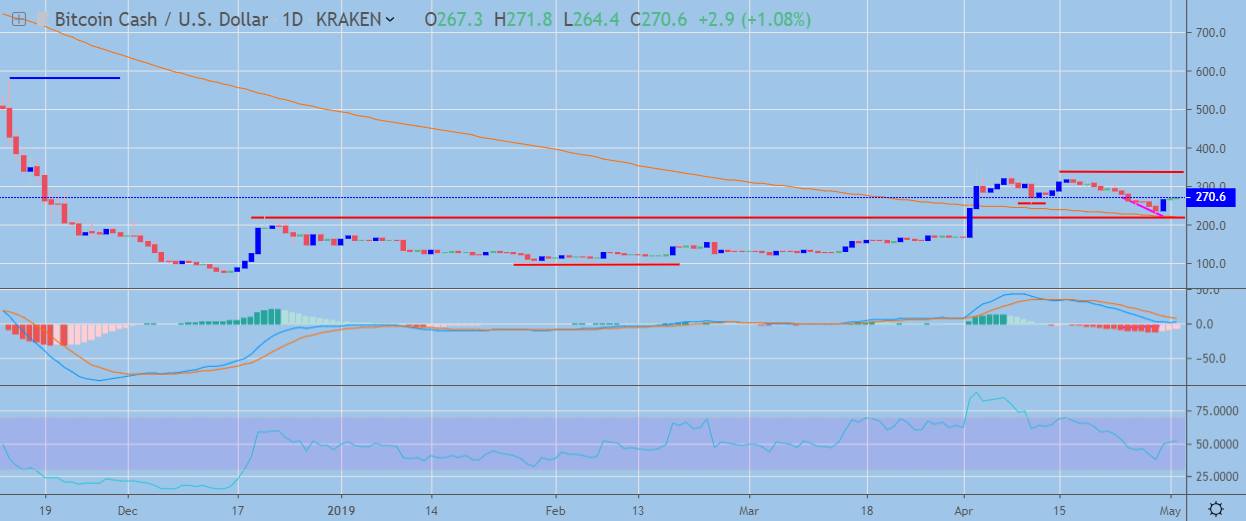
BCH has a bullish medium-term trading outlook, with the BCH / USD pair still trading well above its 200-day moving average.
The daily time frame highlights that major technical support held firm during the recent decline in the BCH / USD pair, with the neckline of the inverted head and shoulders pattern acting as critical technical support.
Technical indicators on the daily time frame are currently mixed and providing no clear trading signal.
 BCH / USD Daily Chart by TradingView
Pattern Watch
The daily time frame shows that a bearish head and shoulders pattern could start to take shape if the BCH / USD pair comes under further downside pressure.
Relative Strength Index
The RSI indicator on the daily time frame is currently neutral.
MACD Indicator
The MACD indicator on the daily time frame is neutral, with both the MACD signal line and the MACD histogram failing to generate a clear trading signal.
Fundamental Analysis
The medium-term prospects for BCH remain highly speculative. The project still lacks mainstream adoption, especially when compared to big names like Bitcoin.
Conclusion
BCH has staged an impressive upside recovery after coming under heavy technical pressure towards critical technical support.
Buyers now need to build on the bullish momentum and move price back above the BCH / USD pair’s 200-period average on the four-hour time frame.
For a quick look into Bitcoin Cash and BCH, check out our coin guide here.