Bitcoin Cash Price Analysis BCH / USD: Battling The Resistance
BCH is attempting to move above the $360 level.
- Bitcoin Cash has a bullish short-term bias, with the BCH / USD pair advancing above its 200-period moving average on the four-hour time frame
- The four-hour time frame depicts a failed attempt to break above an ascending triangle pattern
- The daily time frame highlights that the BCH / USD pair is trading within a confluence of major technical resistance
Bitcoin Cash / USD Short-term price analysis
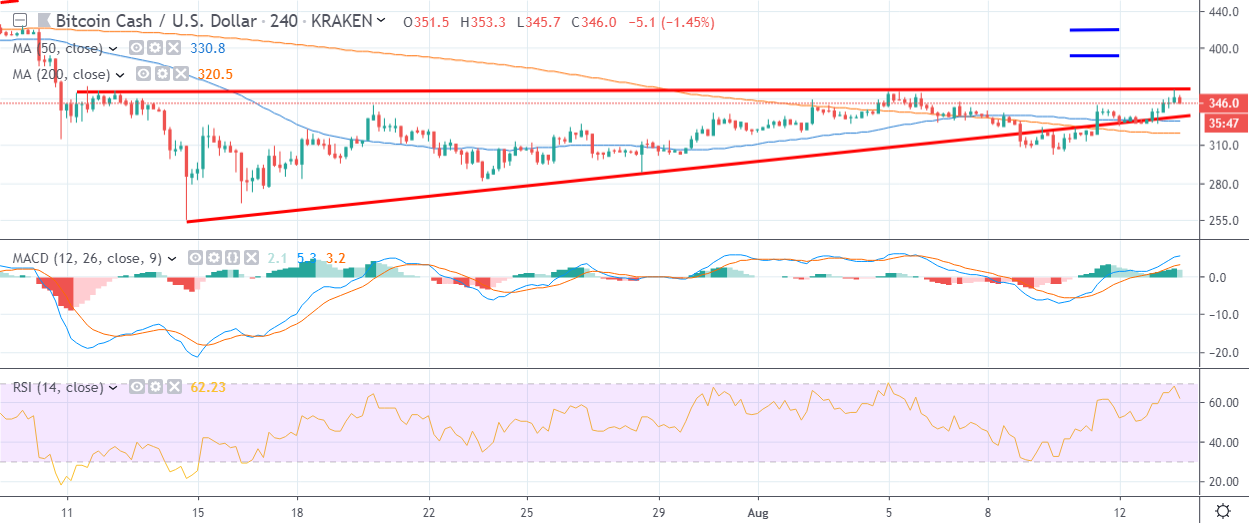
Bitcoin Cash has a bullish short-term trading bias, with the BCH / USD pair continuing to rally above its 200-period moving average on the four-hour time frame.
The four-hour time frame shows that buyers are failing to break above an ascending triangle pattern. The mentioned time frame shows that the $360.00 to $335.00 price range remains critical.
Technical indicators on the four-hour time frame are bullish, although they are now overbought.
Pattern Watch
Traders should note that a bullish breakout from the ascending triangle pattern may spark a rally towards the $380.00 level.
Relative Strength Index
The RSI indicator on the four-hour time is bullish, although it has reached overbought territory.
MACD Indicator
The MACD indicator on the four-hour time frame remains bullish and continues to issue a buy signal.
Bitcoin Cash / USD Medium-term price analysis
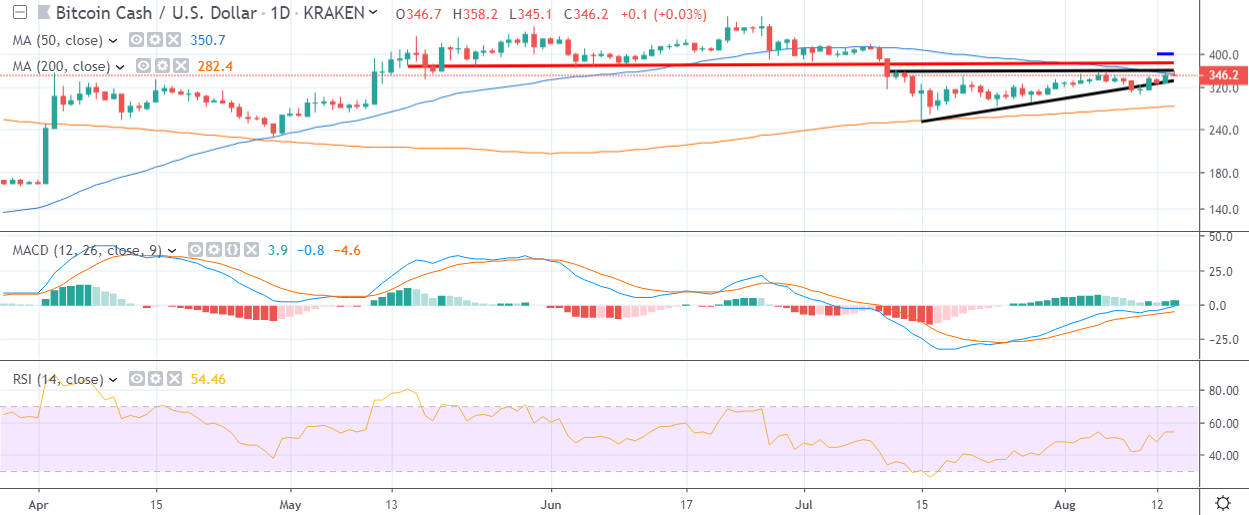
Bitcoin Cash has a bullish medium-term trading outlook, with the BCH / USD pair gaining strength above its key 200-day moving average.
The daily time frame is showing that buyers are struggling to move price above a major confluence of technical resistance around the $360.00 level.
Technical indicators across the daily time frame are bullish and continue to rise.
Pattern Watch
Traders should note that the BCH / USD pair is also struggling to move above the neckline of a bearish head and shoulders pattern on the daily time frame.
Relative Strength Index
The RSI indicator on the daily time frame is rising and shows scope for further upside.
MACD Indicator
The MACD indicator on the daily time frame has turned bullish and continues to issue a buy signal.
Conclusion
Bitcoin Cash continues to edge higher and is currently facing a major hurdle from a confluence of strong technical resistance around the $360.00 level.
Failure to overcome the $360.00 level should provoke a move towards the $335.00 level, while a bullish breakout supports a move towards at least the $380.00 level.
Check out our coin guide for Bitcoin Cash.