 Earn with Nexo

Bitcoin Cash Price Analysis BCH / USD: Lifting Itself Up
BCH has performed a short-term bullish breakout
- Bitcoin Cash has a neutral short-term bias, with the BCH / USD pair trading towards its key 200-period moving average on the four-hour time frame
- The bearish head and shoulders pattern on the four-hour time frame has now reached its full downside projection
- The daily time frame continues to show the BCH / USD pair trading within a rising wedge pattern
Bitcoin Cash / USD Short-term price analysis
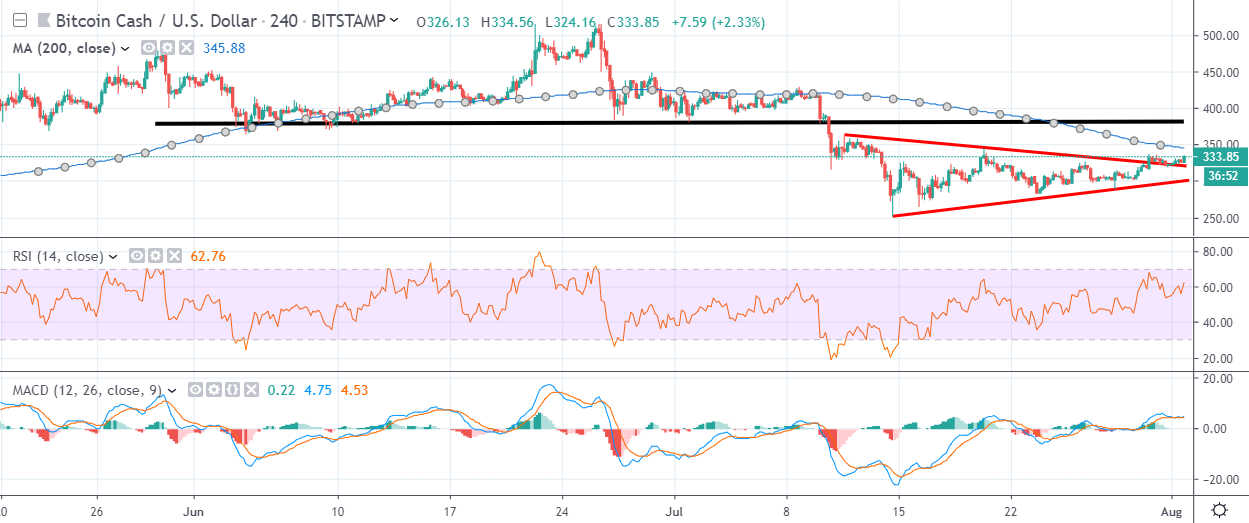
Bitcoin Cash has a neutral short-term trading bias, with the BCH / USD pair testing towards its 200-period moving average on the four-hour time frame.
The four-hour time frame shows a bullish breakout underway from triangle pattern. Bulls may start to test towards the neckline of the large head and shoulders pattern on the mentioned time frame.
Technical indicators on the four-hour time frame are bullish and continue to issue buy signals.
Pattern Watch
Traders should note that the bullish triangle breakout could extend towards the $380.00 resistance level.
Relative Strength Index
The RSI indicator on the four-hour time is bullish, although it is approaching overbought territory.
MACD Indicator
The MACD indicator on the four-hour time frame has turned bullish, with the MACD signal line and histogram both issuing a buy signals.
Bitcoin Cash / USD Medium-term price analysis
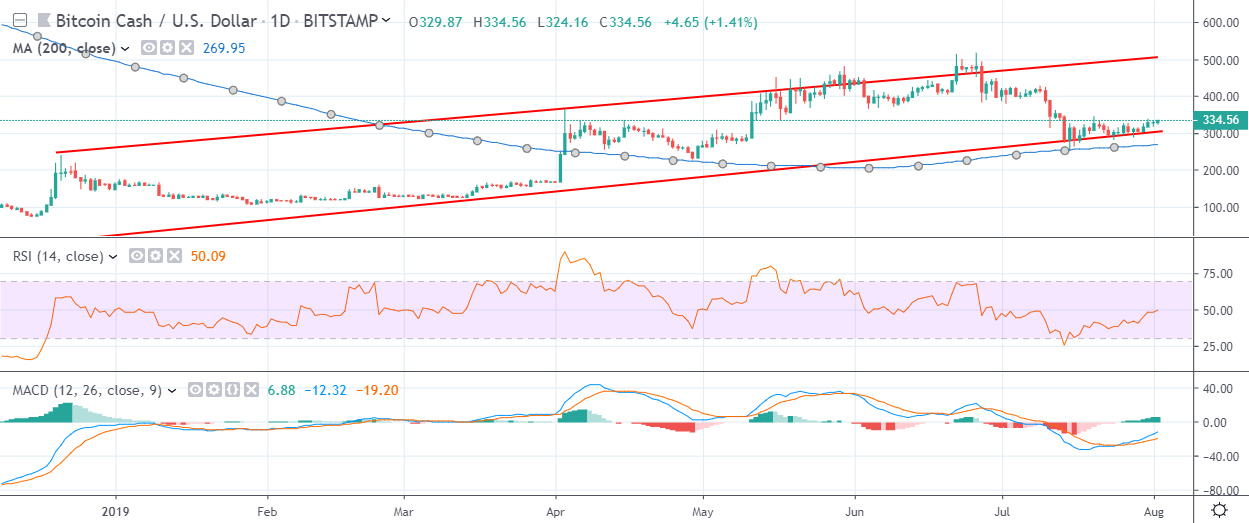
Bitcoin Cash has a bullish medium-term trading outlook, with the BCH / USD pair still holding above its key 200-day moving average.
The daily time frame is showing that the BCH / USD pair is trapped within a rising price channel. Sellers have so far been unable to move price below key trendline support.
Technical indicators across the daily time frame are now starting to turn bullish.
Pattern Watch
Traders should note that a large head and shoulders pattern can also be seen on the daily time frame.
Relative Strength Index
The RSI indicator on the daily time frame is rising and is approaching neutral territory.
MACD Indicator
The MACD indicator on the daily time frame has turned bullish and is now issuing a strong buy signal.
Conclusion
Bitcoin Cash is on the rise after staging a bullish breakout from a symmetrical triangle pattern on the four-hour time frame.
Bears’ failure to move price below the rising price channel on the daily time frame has also encouraged the recent technical rebound in the BCH / USD pair, which could extend towards the $380.00 level.
Check out our coin guide for Bitcoin Cash.