 Earn with Nexo

Bitcoin Cash Price Analysis BCH / USD: Bull Trigger
Bitcoin Cash is finally targeting its November 2018 high with several bullish patterns.
- Bitcoin Cash has a bullish short-term bias, with the BCH / USD pair advancing to a new 2019 trading high
- Bullish inverted head and shoulders patterns have now been triggered on the four-hour and daily time frames
- Bitcoin Cash is increasingly likely to target the November 14th, 2018 swing high
Bitcoin Cash / USD Short-term price analysis
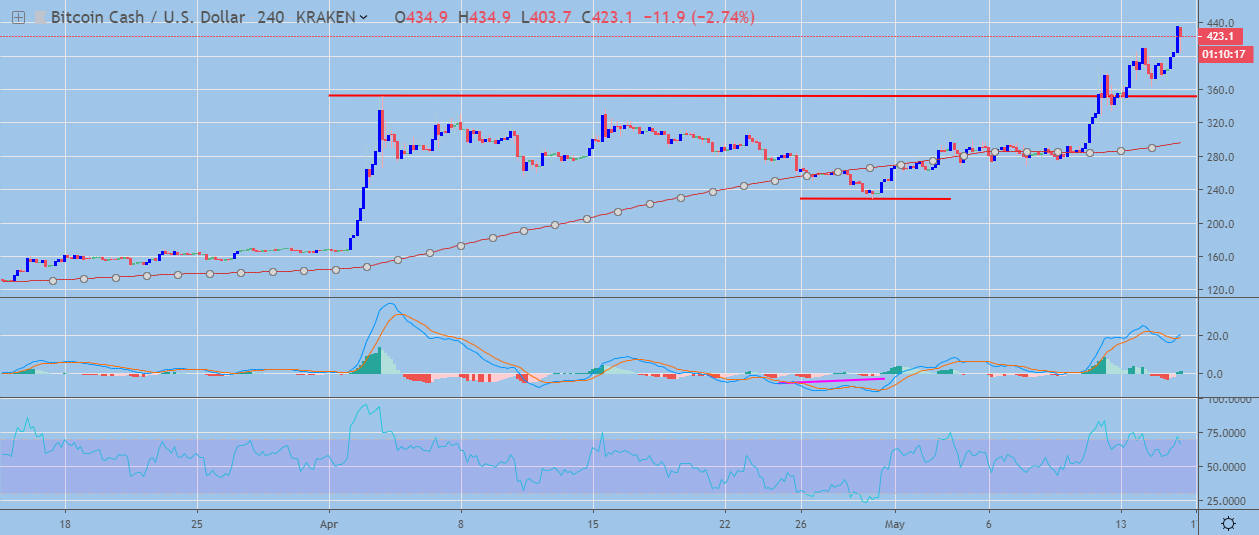
Bitcoin Cash has an increasingly bullish short-term trading bias, with the BCH / USD pair advancing to a new 2019 trading high.
The four-hour time frame is showing that an inverted head and shoulders pattern has now been triggered, with the bullish pattern yet to reach its full upside projection.
Technical indicators on the four-hour time frame are bullish, although they are starting to appear overstretched.
 BCH / USD H4 Chart by TradingView
Pattern Watch
Traders should note that the November 14th, 2018 swing high is the initial target of the bullish inverted head and shoulders pattern on the four-hour time frame.
Relative Strength Index
The RSI indicator on the four-hour time is bullish, although it is now approaching overbought conditions.
MACD Indicator
The MACD indicator on the four-hour time frame is still bullish, although the MACD signal line appears overstretched.
Bitcoin Cash / USD Medium-term price analysis
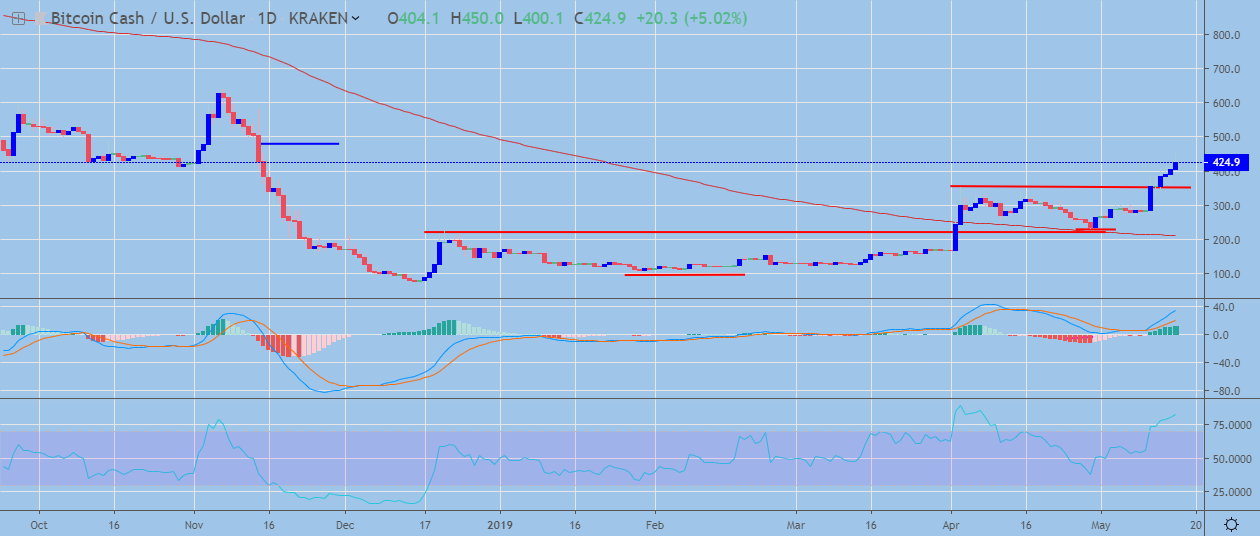
Bitcoin Cash has a bullish medium-term trading outlook, with the BCH / USD pair advancing above the $400.00 level.
The daily time frame is showing that a bullish inverted head and shoulders pattern has been triggered, with buyers attempting to erase the heavy losses the cryptocurrency incurred during November 2018.
Technical indicators on the daily time frame are bullish and continue to generate a bullish trading signal.
 BCH / USD Daily Chart by TradingView
Pattern Watch
The daily time frame is showing that an even larger inverted shoulders pattern could start to take shape if the BCH / USD erases all of its November 2018 losses.
Relative Strength Index
The RSI indicator on the daily time frame is bullish, although it is now trading in extremely overbought territory.
MACD Indicator
The MACD indicator on the daily time frame is bullish, with both the MACD signal line and histogram issuing a buy signal.
Conclusion
Bitcoin Cash is looking increasingly bullish above the $400.00 level, with both time frames pointing to further gains towards at least the $480.00 level.
If bulls manage to reverse all of the BCH / USD pair’s November 2018 losses, a much larger bullish pattern may start to form across the daily time frame.
For a quick look into Bitcoin Cash and BCH, check out our coin guide here.