
Shutterstock cover by Zheltikov Dmitry
Bitcoin, Ethereum Hit Critical Resistance
Bitcoin and Ethereum have one significant resistance level to break to be able to advance further.
Bitcoin and Ethereum have both struggled to recover from their recent losses and now face resistance ahead. Still, the network dynamics suggest that the downside potential is limited.
Bitcoin Is Under Pressure
Bitcoin continues to trend downwards as it faces resistance.
The leading cryptocurrency tried to regain the 100-twelve-hour moving average as support on Nov. 20, shortly after the Tom DeMark Sequential presented a buy signal. Although BTC rebounded from a low of $55,600, the $60,000 resistance barrier slowed down the upswing. The rejection resulted in a 5.5% correction that pushed prices back below $57,000.
As Bitcoin fails to overcome the $60,000 hurdle, market participants appear to be turning pessimistic.
Behavior analytics platform Santiment recorded a change in BTC traders’ perception due to the downward price action earlier today. The last time the market showed such negative sentiment was in early October. Still, the uncertainty could be interpreted as a “good sign of capitulation.”
Bitcoin must break through the 100-twelve-hour moving average at $60,000 to advance higher. More importantly, it needs to print a 12-hour candlestick close above the 50-twelve-hour moving average at $62,400 to confirm the uptrend has resumed. Once both of these milestones are achieved, BTC could rise to retest its previous all-time high at nearly $70,000.
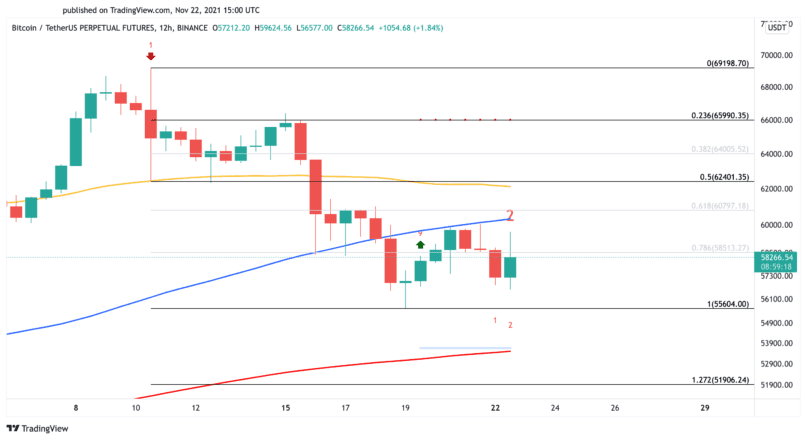
Failing to break through the $60,000 to $62,400 supply wall could lead to further losses. A spike in selling pressure could result in a downswing toward the recent low at $55,600. If this support level is not significant enough to hold, a test of the 200-twelve-hour moving average at $53,600 could be imminent.
Ethereum Holds Strong
Ethereum is trading above a strong demand barrier that could ignite another leg up.
The second-largest cryptocurrency by market cap has seen a large amount of tokens taken out of circulation in recent months. Since implementing its EIP-1559 fee burning proposal in August’s London hardfork, nearly 978,000 ETH worth more than $4 billion have been burned. The significant supply reduction paints a positive picture for Ethereum’s future price growth as it technically reduces the number of ETH available to sell, consequently capping the downside potential.
This could explain how Ethereum has been able to hold above $4,000 after the recent correction seen across the entire cryptocurrency market. From a technical perspective, it appears that the 100-twelve-hour moving average is acting as a stable support level. Still, ETH must break through the 50-twelve-hour moving average at $4,500 to print higher highs.
Slicing through such a significant supply area could see Ethereum march toward its previous all-time high at nearly $4,900, with $4,660 acting as an intermediate resistance level.
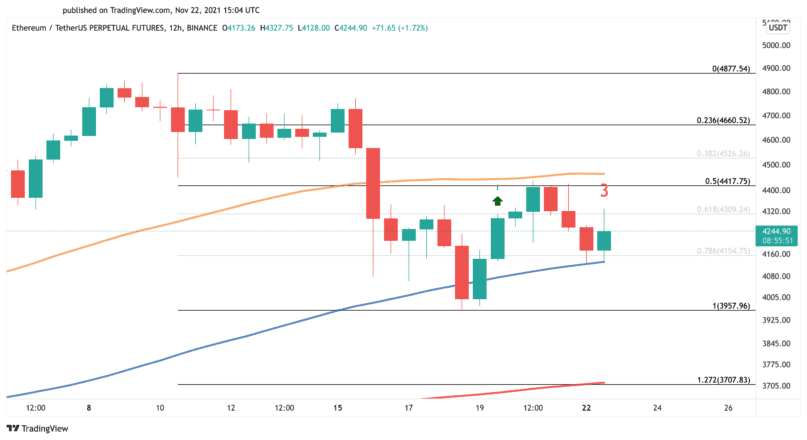
It is worth noting that Ethereum must continue to trade above the 100-twelve-hour moving average to advance further. A breach of this support level could put on hold the optimistic outlook, leading to a correction towards the 200-twelve-hour moving average at $3,700.
Disclosure: At the time of writing, the author of this feature owned BTC and ETH.