
Bitcoin Nearly Breaks $7,300, Buyer Enthusiasm Is Back
As the halving approaches, Bitcoin's wild price action is back, providing over $500 gains in less than 4 hours.
Bitcoin started the month of April strong surging over 17% in the past two days. Now, BTC could be preparing for a further upswing.
Volatility Is Back in the Market
After weeks of consolidation, volatility has struck the cryptocurrency market. Indeed, over $15 billion flooded the industry today, pushing the total market cap to nearly $200 billion. Meanwhile, Bitcoin saw its price surge by nearly 10% to reach a high of $7,300.
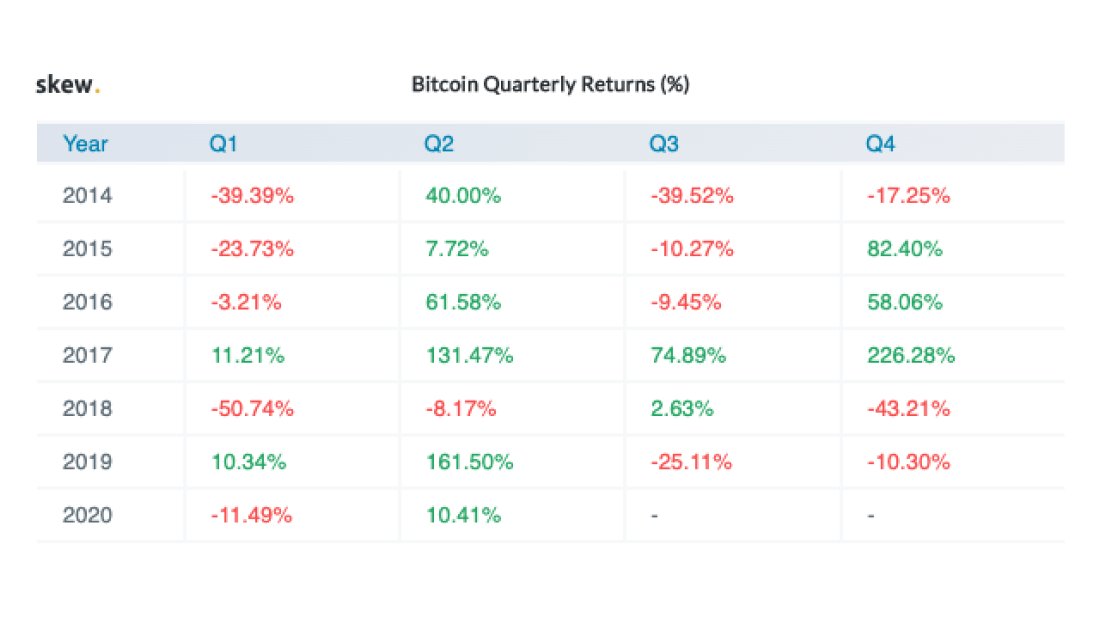
This price action allowed the flagship cryptocurrency to start the second quarter of the year in a bullish posture after its poor performance in Q1, according to crypto derivatives data provider Skew.
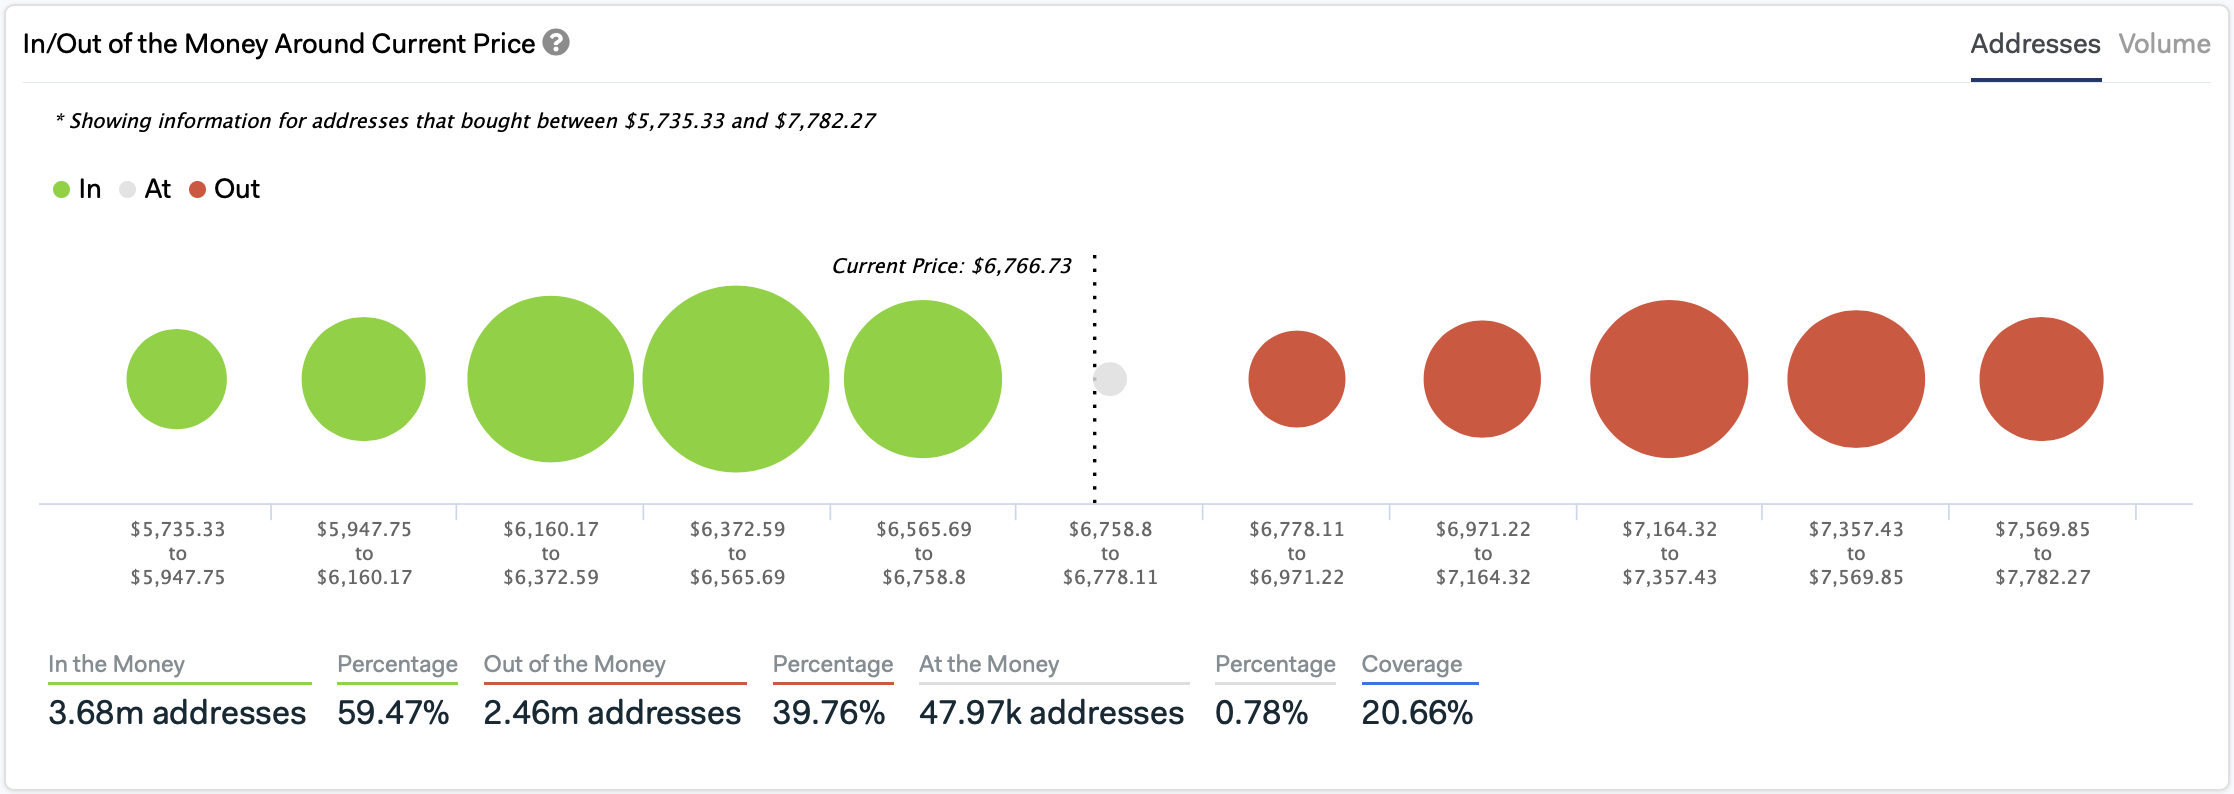
Despite the substantial bullish momentum seen recently, it appears that an important supply barrier was able to contain Bitcoin from a further advance.
IntoTheBlock’s “In/Out of the Money Around Current Price” model reveals that over 800,000 addresses containing more than 380,000 BTC, at an average price of $7,270, served as strong resistance. This hurdle was significant enough to reject the bellwether cryptocurrency, pushing its price back below $7,000.
Technical Indexes Estimate a Further Advance
From a technical perspective, however, the rejection came off the 200-four-hour moving average as Bitcoin was attempting to break out of an ascending triangle that is developing in its 4-hour chart. This technical formation is considered to be a continuation pattern that forecasts a 34% target to the upside from the breakout point.
An increase in the buying pressure behind BTC could allow it to climb up to over $9,000. This target is determined by measuring the height of the triangle at its thickest point and adding that distance to the breakout point.
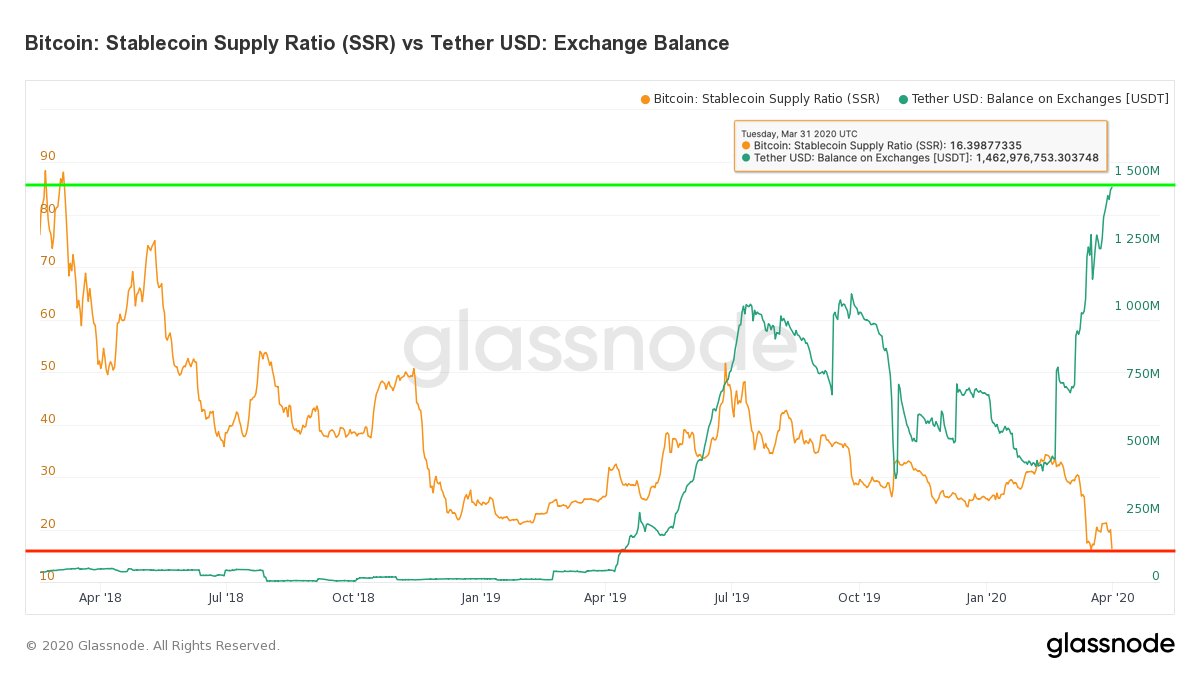
Adding credence to the optimistic outlook, Glassnode recently affirmed that the Stablecoin Supply Ratio is near its all-time low. The on-chain market intelligence provider maintains that a low ratio means that there is enough buying power in stablecoins to purchase Bitcoin and subsequently send its price up.
“USDT (ERC20) exchange balances at an [all-time high] indicates that those coins are waiting on the sidelines,” said Glassnode.
Nonetheless, it is worth noting that ascending triangles can also form as reversal patterns to an uptrend. For this to happen, Bitcoin would have to break through the hypotenuse of the triangle and its 100-four-hour moving average. Such a bearish impulse would likely be followed by a spike in supply that pushes BTC down to $4,500.
It remains uncertain what the future holds for the flagship cryptocurrency as it goes through its first global economic slowdown. However, prominent analyst Nunya Bizniz believes that the run-up to the upcoming halving will be bullish.
The chartist argues that based on historical data Bitcoin has rallied strongly in anticipation to the prior two block rewards reduction events. Now, a similar scenario could take place, affirmed Nunya Bizniz.