 Earn with Nexo

Bitcoin Price Analysis BTC / USD: Battle Of The Traders
Bulls and bears are locked tight in the current price trends.
- Bitcoin has a short-term bullish bias, with the cryptocurrency once again hold price above its 200-period moving average on the four-hour time frame
- The BTC / USD pair needs to break above neckline resistance at $8,500
- The daily time frame continues to show that the $10,000 level remains a valid bullish target
Bitcoin / USD Short-term price analysis
Bitcoin has a bullish short-term trading outlook, with the BTC / USD pair continuing to hold price above its 200-period moving average on the four-hour time frame.
The four-hour time frame continues to show bulls and bears locked in a battle over the short-term, with a valid inverted head and shoulders pattern and a valid head and shoulders pattern still in play.
Technical indicators on four-hour time frame are rising and have a bullish bias.
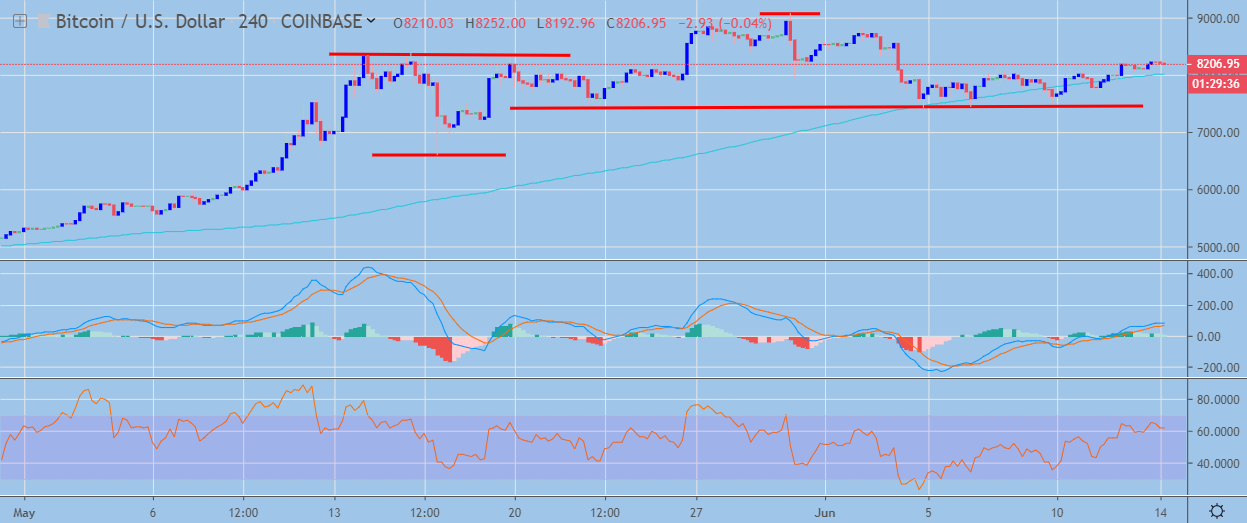
Pattern Watch
Traders should note that the four-hour time frame is showing that a move above the $9,000 level will invalidate the presence of any bearish patterns.
Relative Strength Index
The Relative Strength indicator on the four-hour time frame has turned bullish and is gradually rising alongside price.
MACD Indicator
The MACD indicator on the four-hour time frame has turned bullish and continues to issue a buy signal.
Bitcoin / USD Medium-term price analysis
Bitcoin has a bullish medium-term trading outlook, with the BTC / USD pair staging a strong recovery from critical technical support on the daily time frame.
The daily time frame is showing that the BTC / USD pair is once again approaching the neckline of a large inverted head and shoulders pattern, which is located around the $8,500 level.
Technical indicators on the daily time frame are attempting to turn bullish, following a much needed technical correction lower.
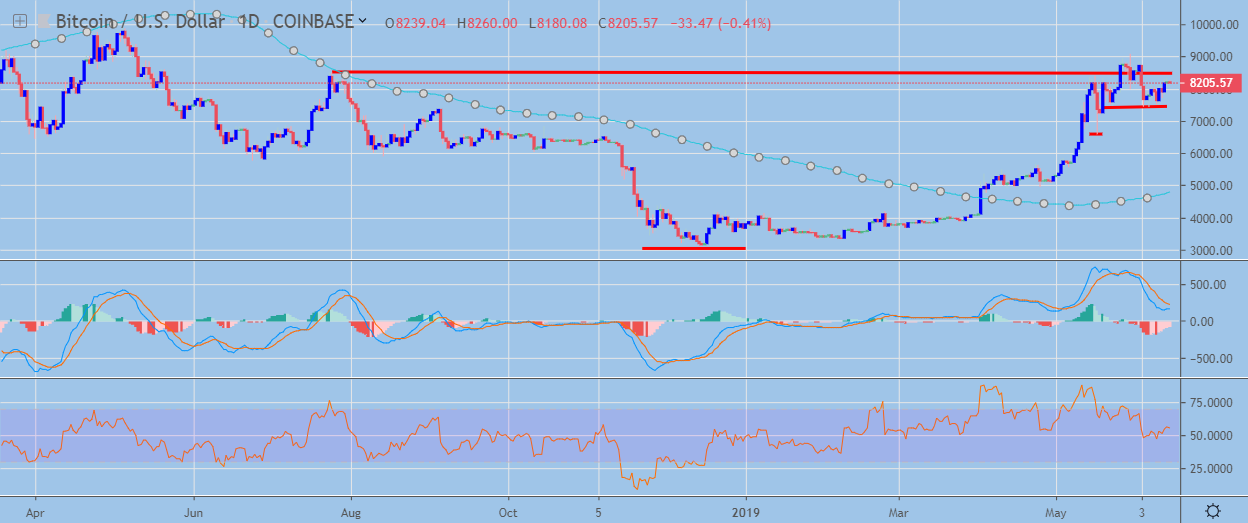
Pattern Watch
Traders should note that the daily time frame is showing that the $10,000 level remains a valid target for the BTC / USD pair .
Relative Strength Index
The Relative Strength indicator on the daily time frame is turning higher and starting to trade above neutral.
MACD Indicator
The MACD indicator on the daily time frame is attempting to turn bullish as medium-term upside pressures increase.
Conclusion
Bitcoin has gradually been rising above the $8,000 level after staging a much-needed technical correction from extremely overbought conditions.
The daily time frame is showing that a sustained move above the $8,500 level will cement the BTC / USD pair’s bullish outlook, while the four-hour time frame is highlighting that a move back above the $9,000 level is critical for short-term bulls.
Bitcoin was the first of our coin guides, and is also our highest-rated deep research project.