 Earn with Nexo

Bitcoin / USD Technical Analysis: Critical Round
A renewed bullish bias for Bitcoin might not last for long if it fails to move above the $5500 level.
- Bitcoin has a bullish short-term outlook, with the BTC / USD pair regaining bullish momentum above the $5,100 level
- The four-hour time frame shows a bearish head and shoulders pattern
- The Ichimoku indicator on daily time frame is showing that the $5,200 level is an important pivot
Bitcoin / USD Short-term price analysis
Bitcoin has a bullish short-term trading bias, with the BTC / USD pair making a strong upside recovery after briefly dipping below the $5,000 support level.
The four-hour time frame shows that a head and shoulders pattern is taking shape, with bulls needing to rally the BTC / USD pair above the current yearly trading high to invalidate the bearish pattern.
Technical indicators on four-hour time frame are bullish and highlight the growing short-term buying interest for the BTC / USD pair.
 BTC / USD H4 Chart by TradingView
Pattern Watch
Traders should note that the bearish head and shoulders pattern could trigger a strong technical reversal back towards the $4,500 support level.
Relative Strength Index
The Relative Strength Index on the mentioned time frame is bullish and highlights growing bullish pressure.
MACD Indicator
The MACD indicator on the four-hour time frame is bullish, with the MACD signal line issuing a strong buy signal.
Bitcoin / USD Medium-term price analysis
Bitcoin remains bullish over the medium-term, with the number one cryptocurrency by market capitalization holding firm above its key 200-day moving average.
The Ichimoku indicator on the daily time frame is showing the importance of daily price closes above the $5,200 level. If bulls repeatedly fail to close the daily candle above the $5,200 level, a decline back towards $4,700 level seems likely.
Technical indicators on the daily time frame are attempting to recover higher after the most recent decline in the BTC / USD pair.
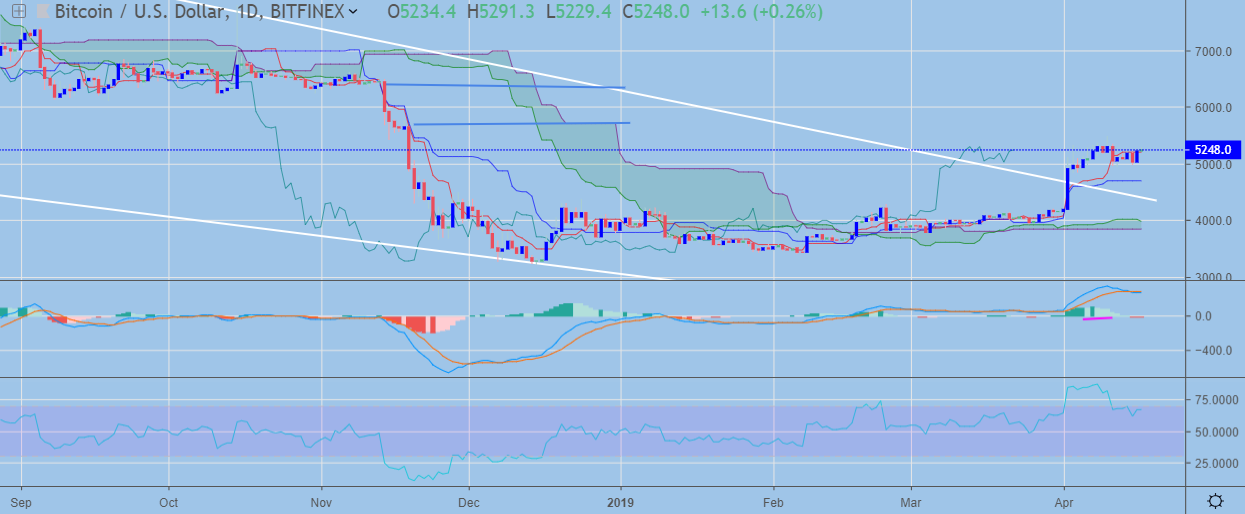 BTC / USD Daily Chart by TradingView
Pattern Watch
Traders should note that the recent technical breakout on the daily time remains valid while price trades above trendline support from the falling wedge pattern.
Relative Strength Index
The Relative Strength Index on the daily time frame is attempting to stabilize after the recent move lower in the BTC / USD pair.
MACD Indicator
The MACD indicator on the daily time frame is conflicted, with the MACD signal line in overbought territory, while the MACD histogram is still trending lower.
Conclusion
Bitcoin has managed to stabilize price above the $5,200 level following the recent sharp decline from the BTC / USD pair’s current yearly trading high.
Bulls must continue to close the daily candle above the $5,200 level and rally the cryptocurrency above the $5,500 level to encourage fresh technical buying interest and invalidate the bearish pattern on the four-hour time frame.