
Bitcoin Whales Buying More BTC After Recent Flash Crash
Even though Bitcoin's recent price action has scared many investors, there are others who appear to be substantially increasing their holdings.
Bitcoin’s price action has been chaotic over the last few days. Whales are confident about the future, however, and various on-chain metrics support their bullish view.
BTC Whales Accumulate, Fundamentals Turn Bullish
This week has been a dramatic one for the flagship cryptocurrency.
On Monday, its price was able to rise by more than 10% and move past the infamous $10,000 threshold.
A few hours later, however, after some of the most prominent analysts in the industry started calling for moonshots, BTC took a brutal $1,000 nosedive that erased these gains in a matter of minutes.
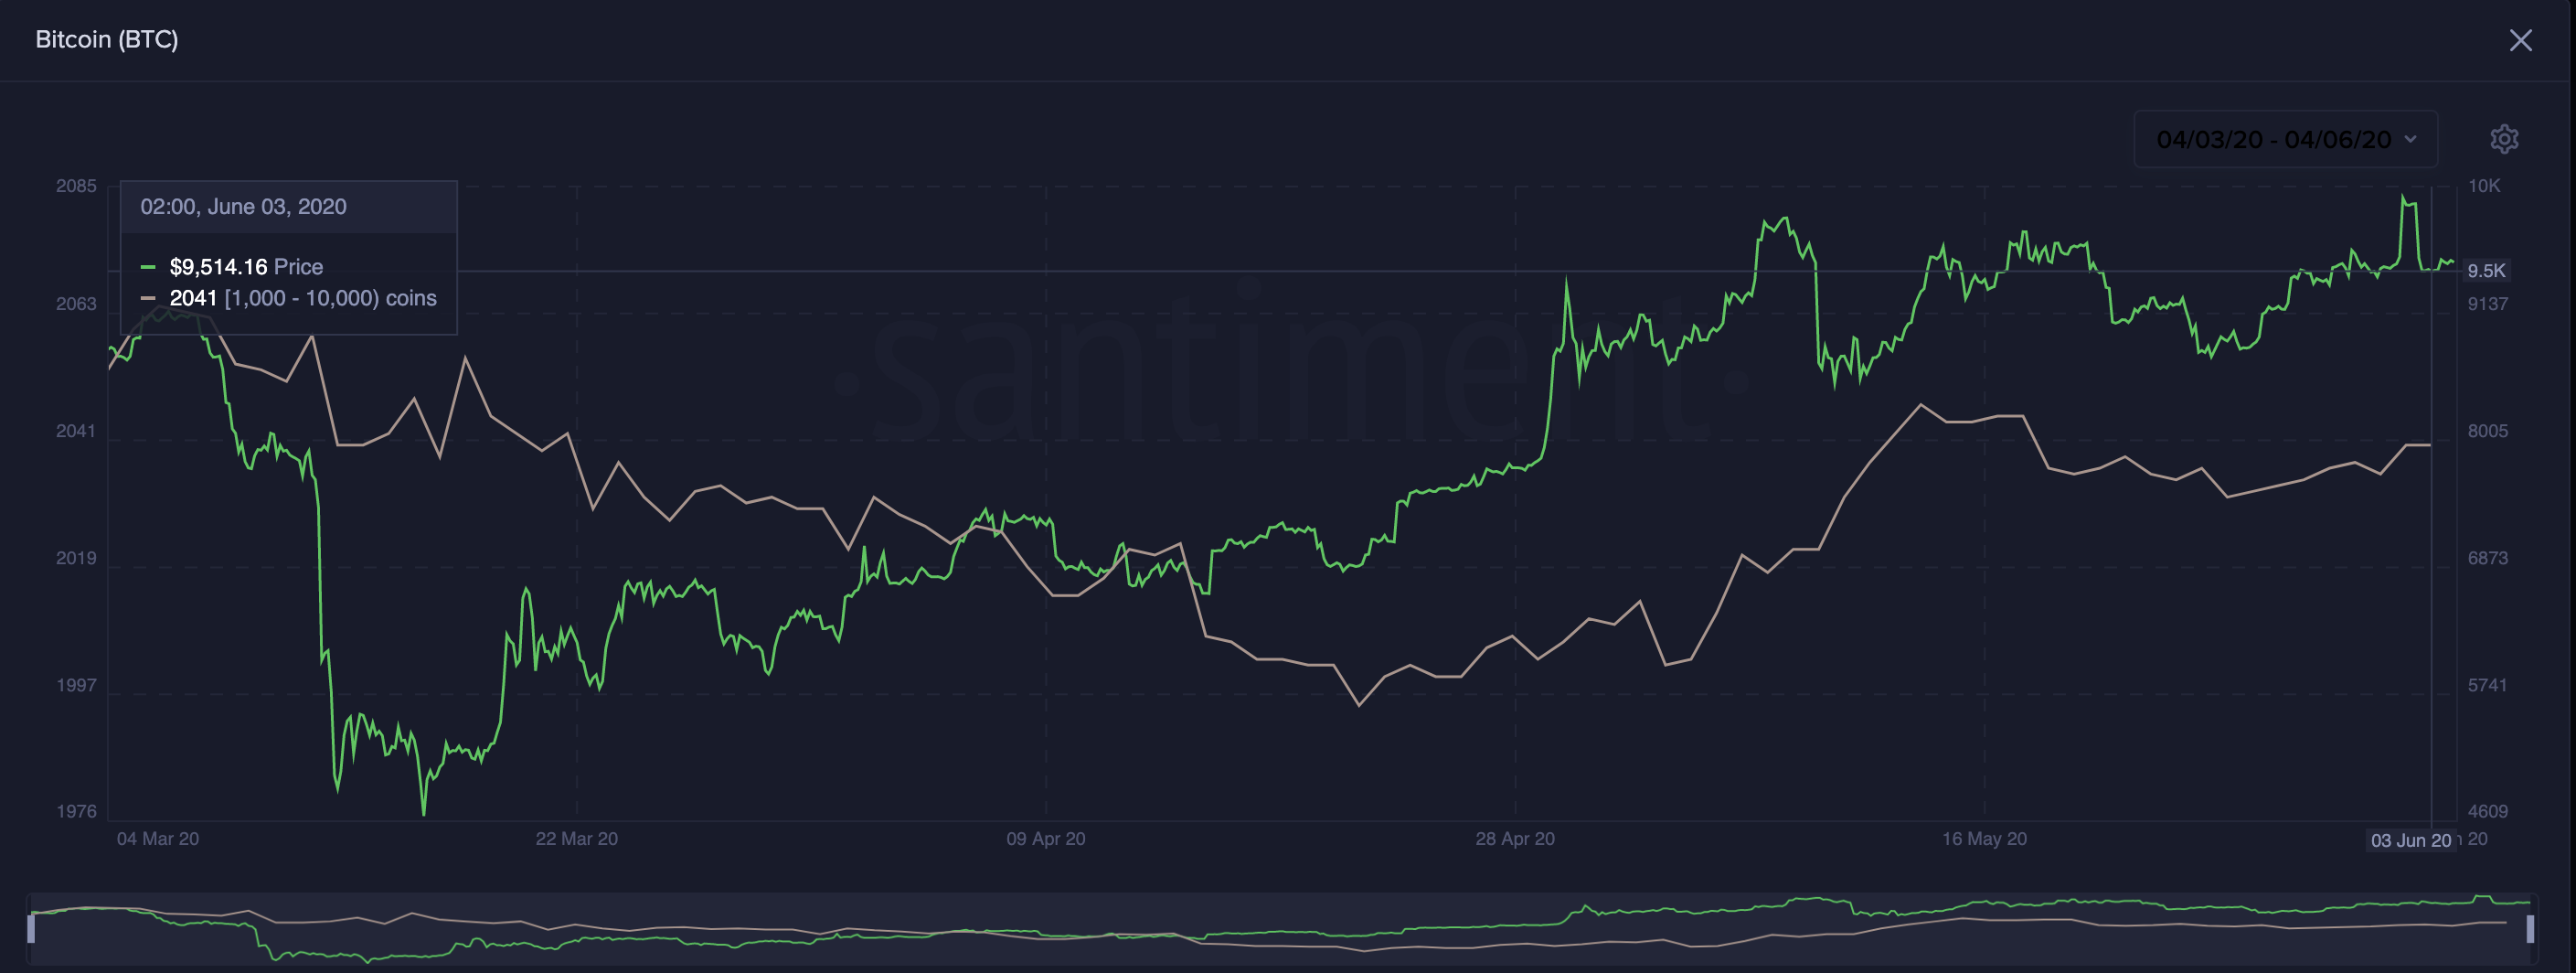
While many panicked over the extreme price action, the number of addresses with significant holdings began rising again.
Santiment’s “holders distribution” index shows that the recent flash crash was significant enough for large investors to add to their positions. Indeed, the number of addresses with 1,000 to 10,000 BTC jumped as Bitcoin reached a low of $9,150 across several cryptocurrency exchanges.
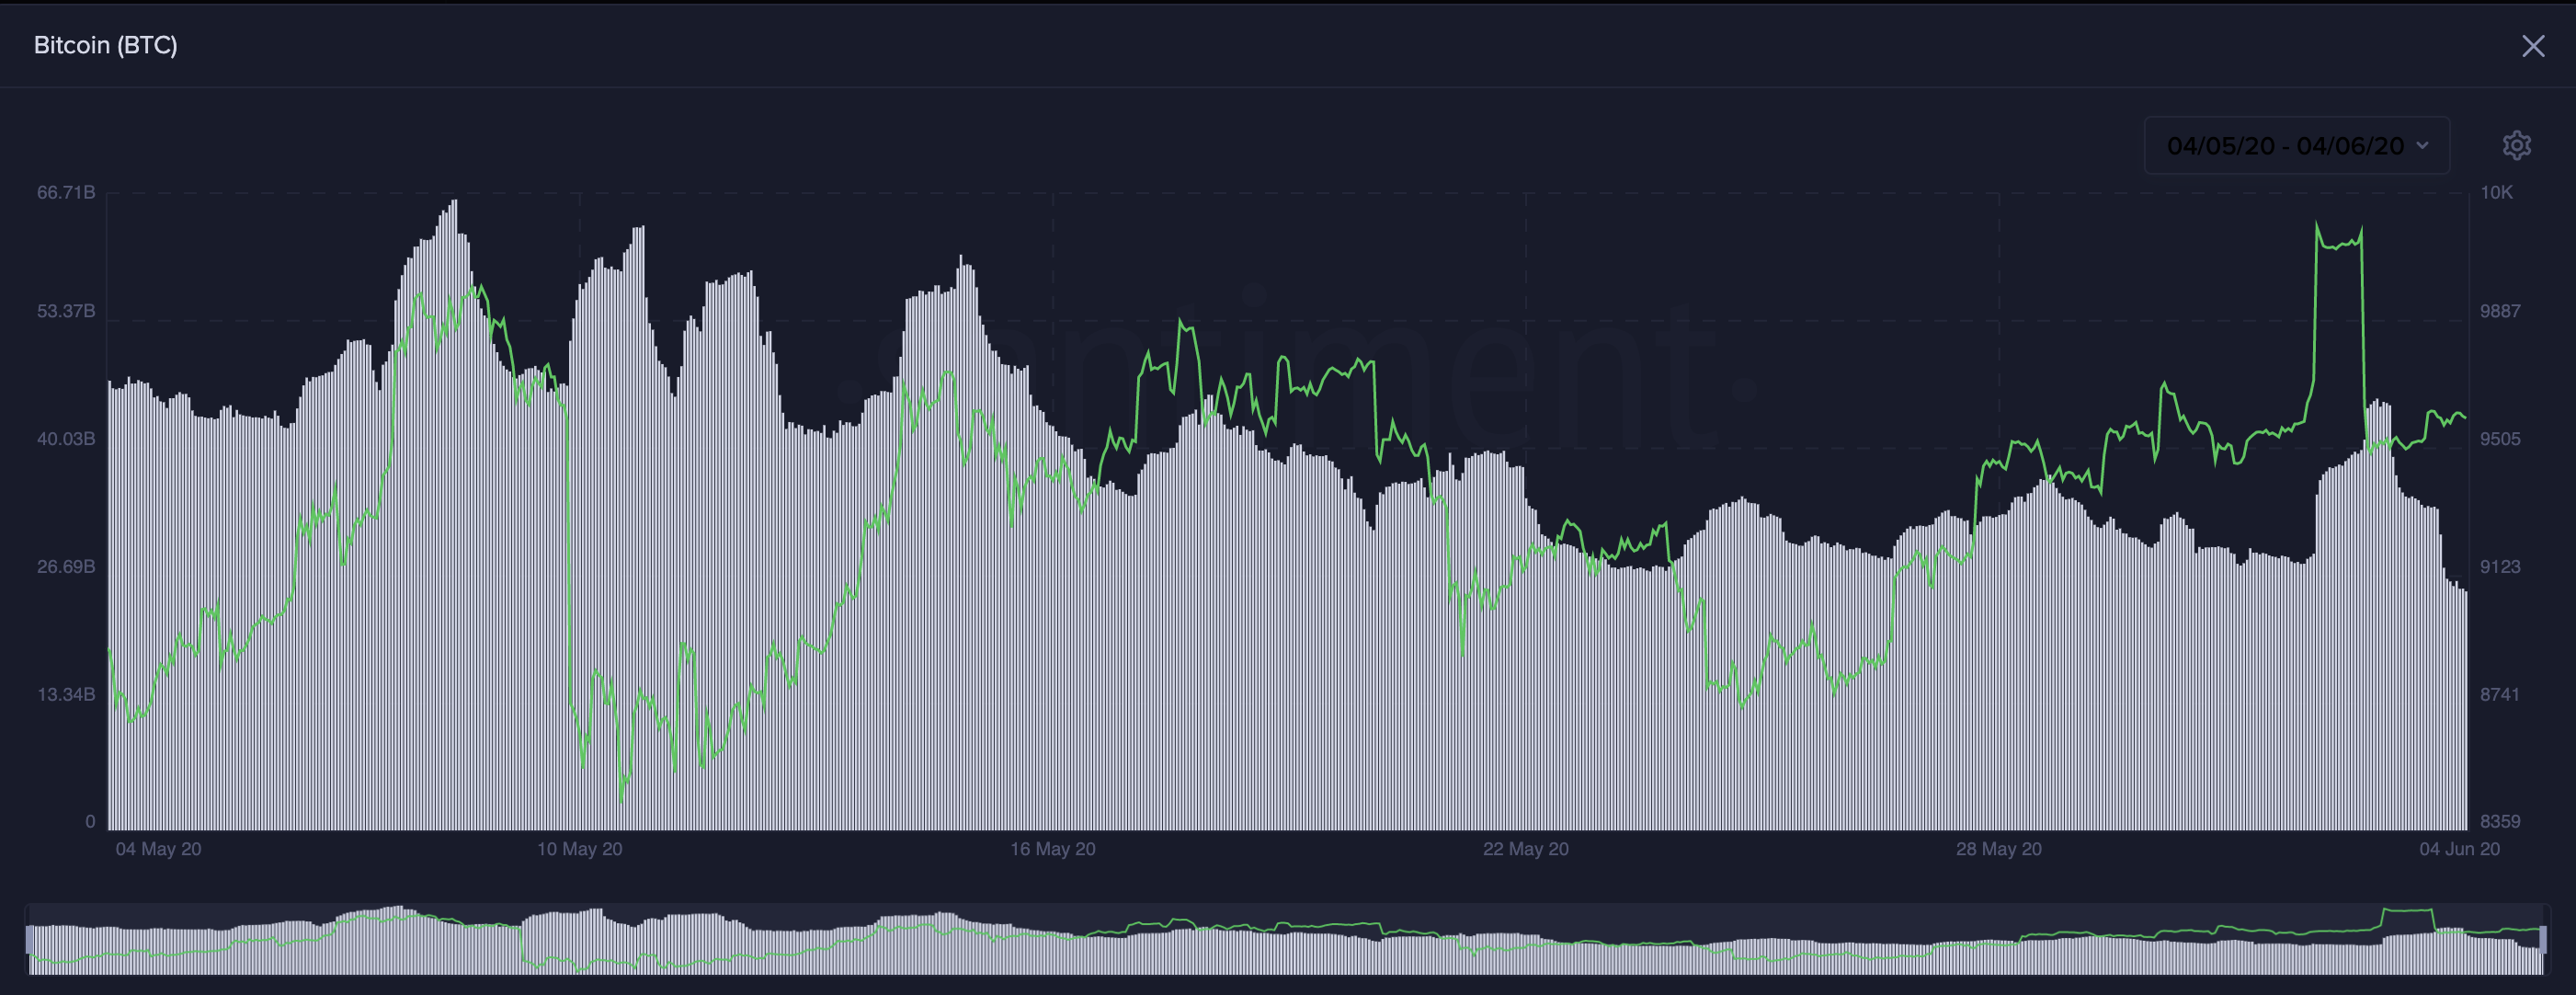
Since the crash, Bitcoin’s on-chain volume suggests that a rebound to pre-crash levels is in the making.
This fundamental metric had leveled off and was steadily declining after early May’s peak of just over $10,000. But following the erratic price behavior seen over the past few days, there was an uptick in on-chain volume.
If this metric continues to increase, the bellwether cryptocurrency could indeed advance further up or at least recover the losses incurred yesterday.
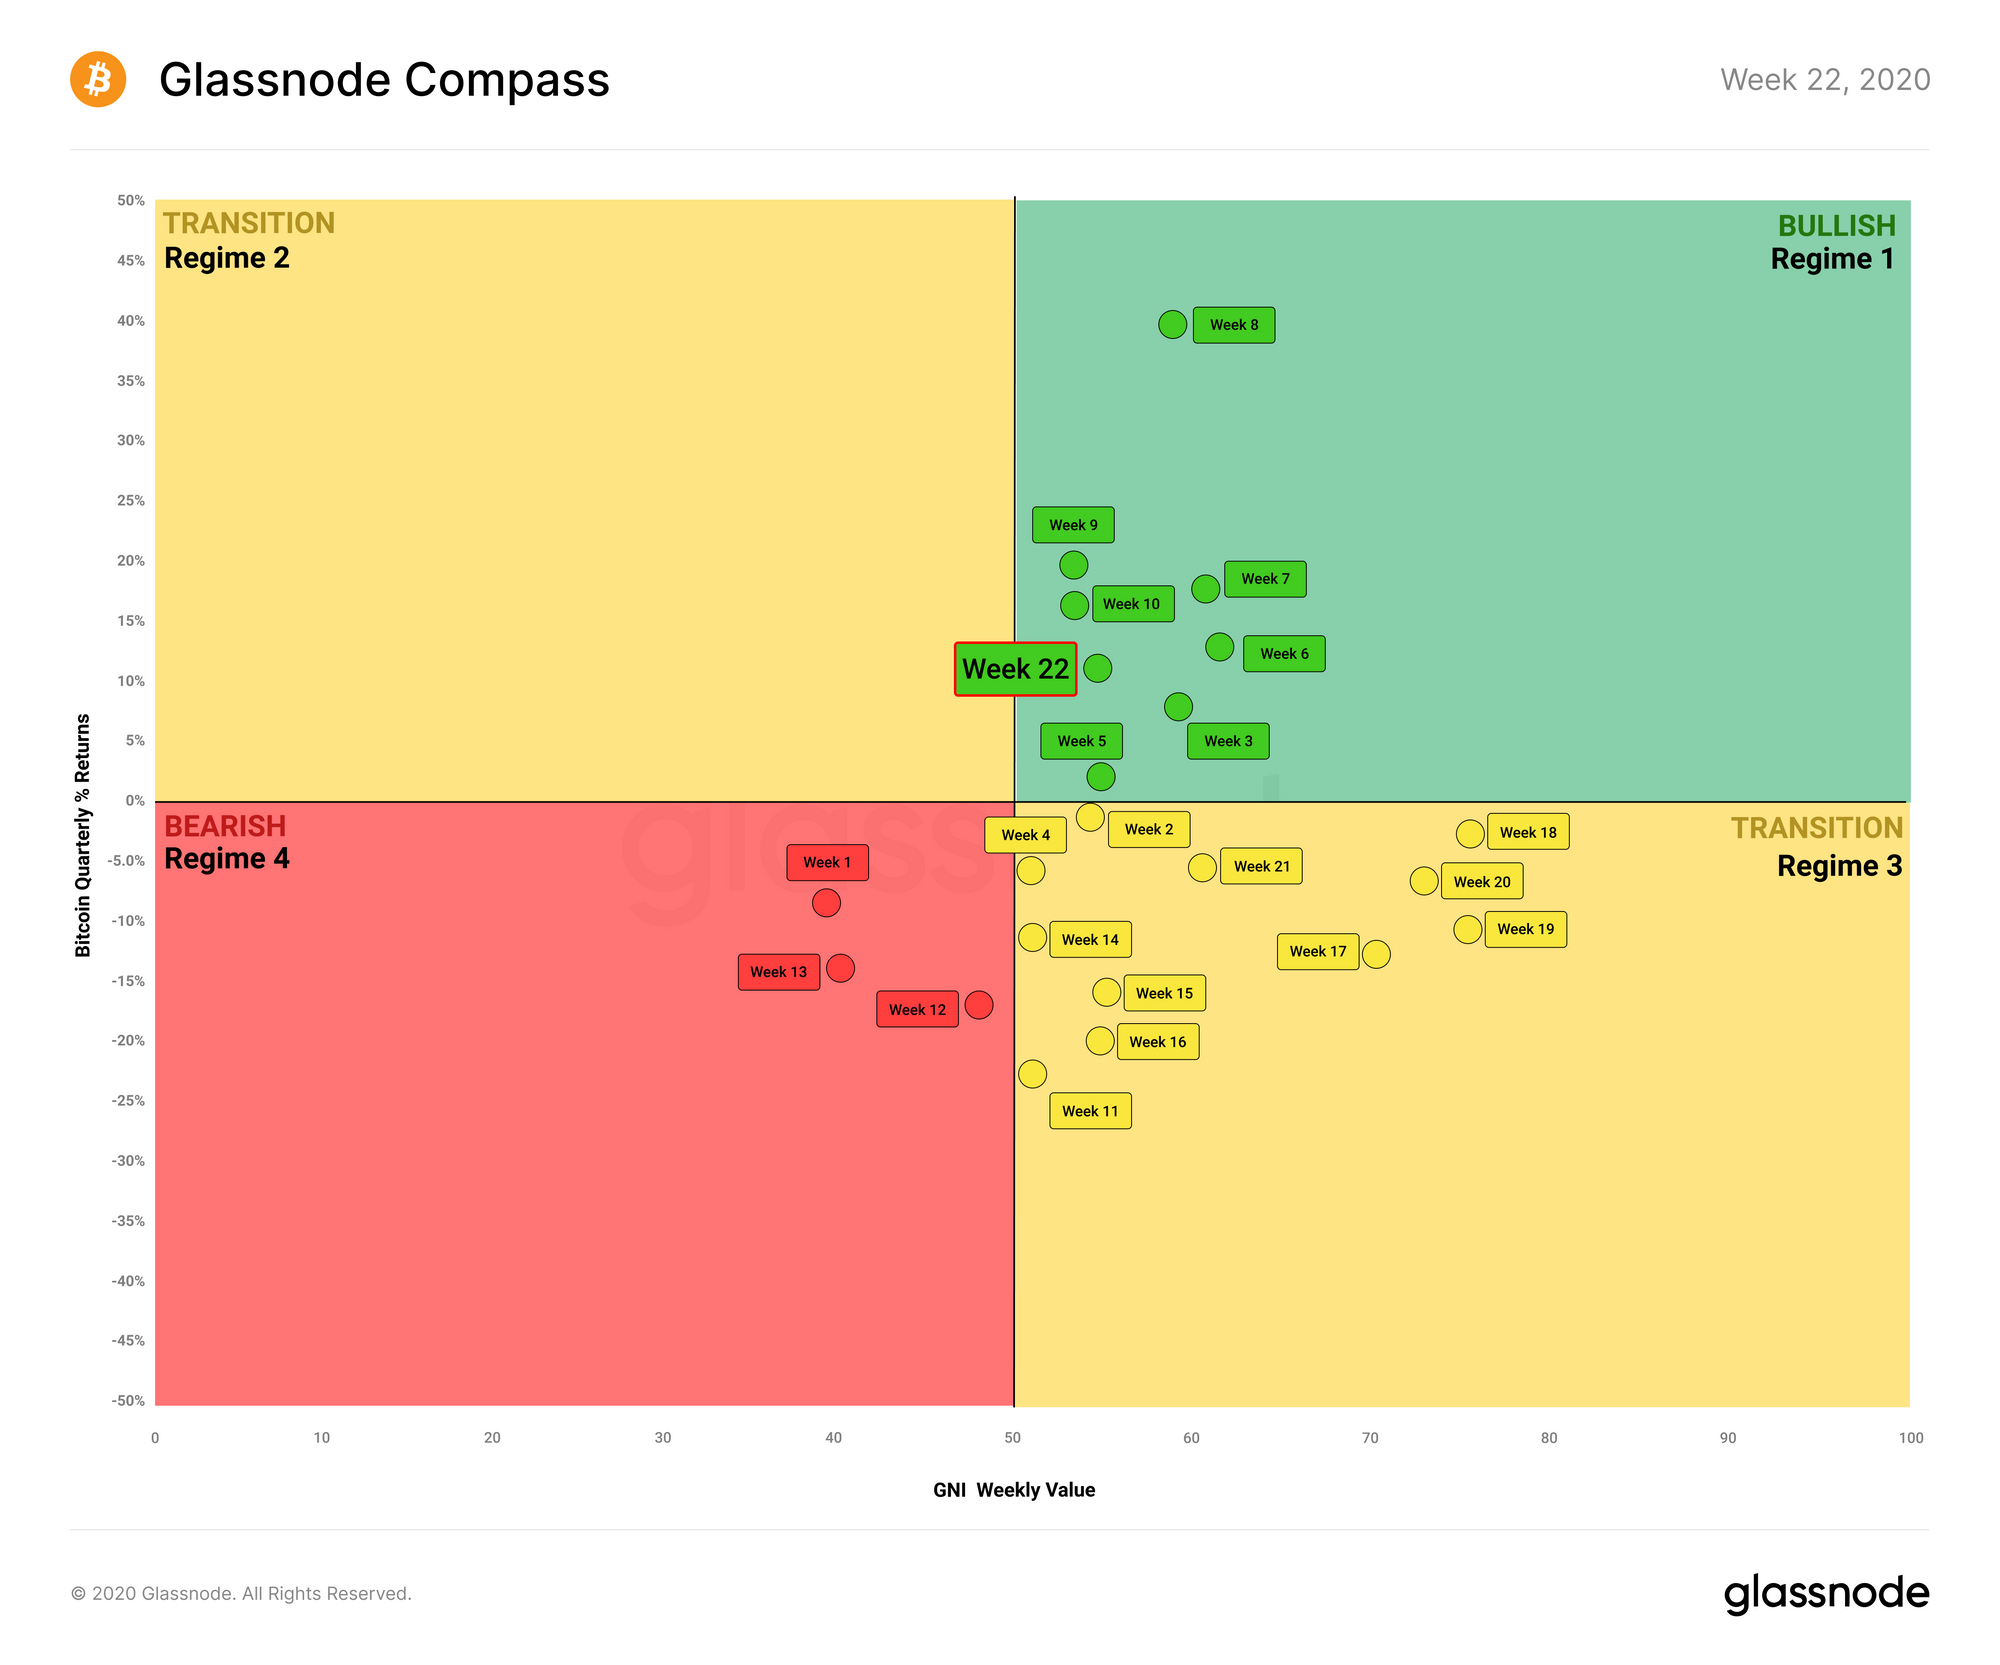
With such a high probability of an upswing, the Glassnode Compass has pushed Bitcoin back into the bullish regime for the first time in the past three months.
This marks the return to pre-March’s Black Thursday levels, according to Glassnode.
The Glassnode Compass outlines the general regime in which Bitcoin is currently located based on its on-chain fundamentals and its recent price behavior.
Strong Support and Resistance Ahead
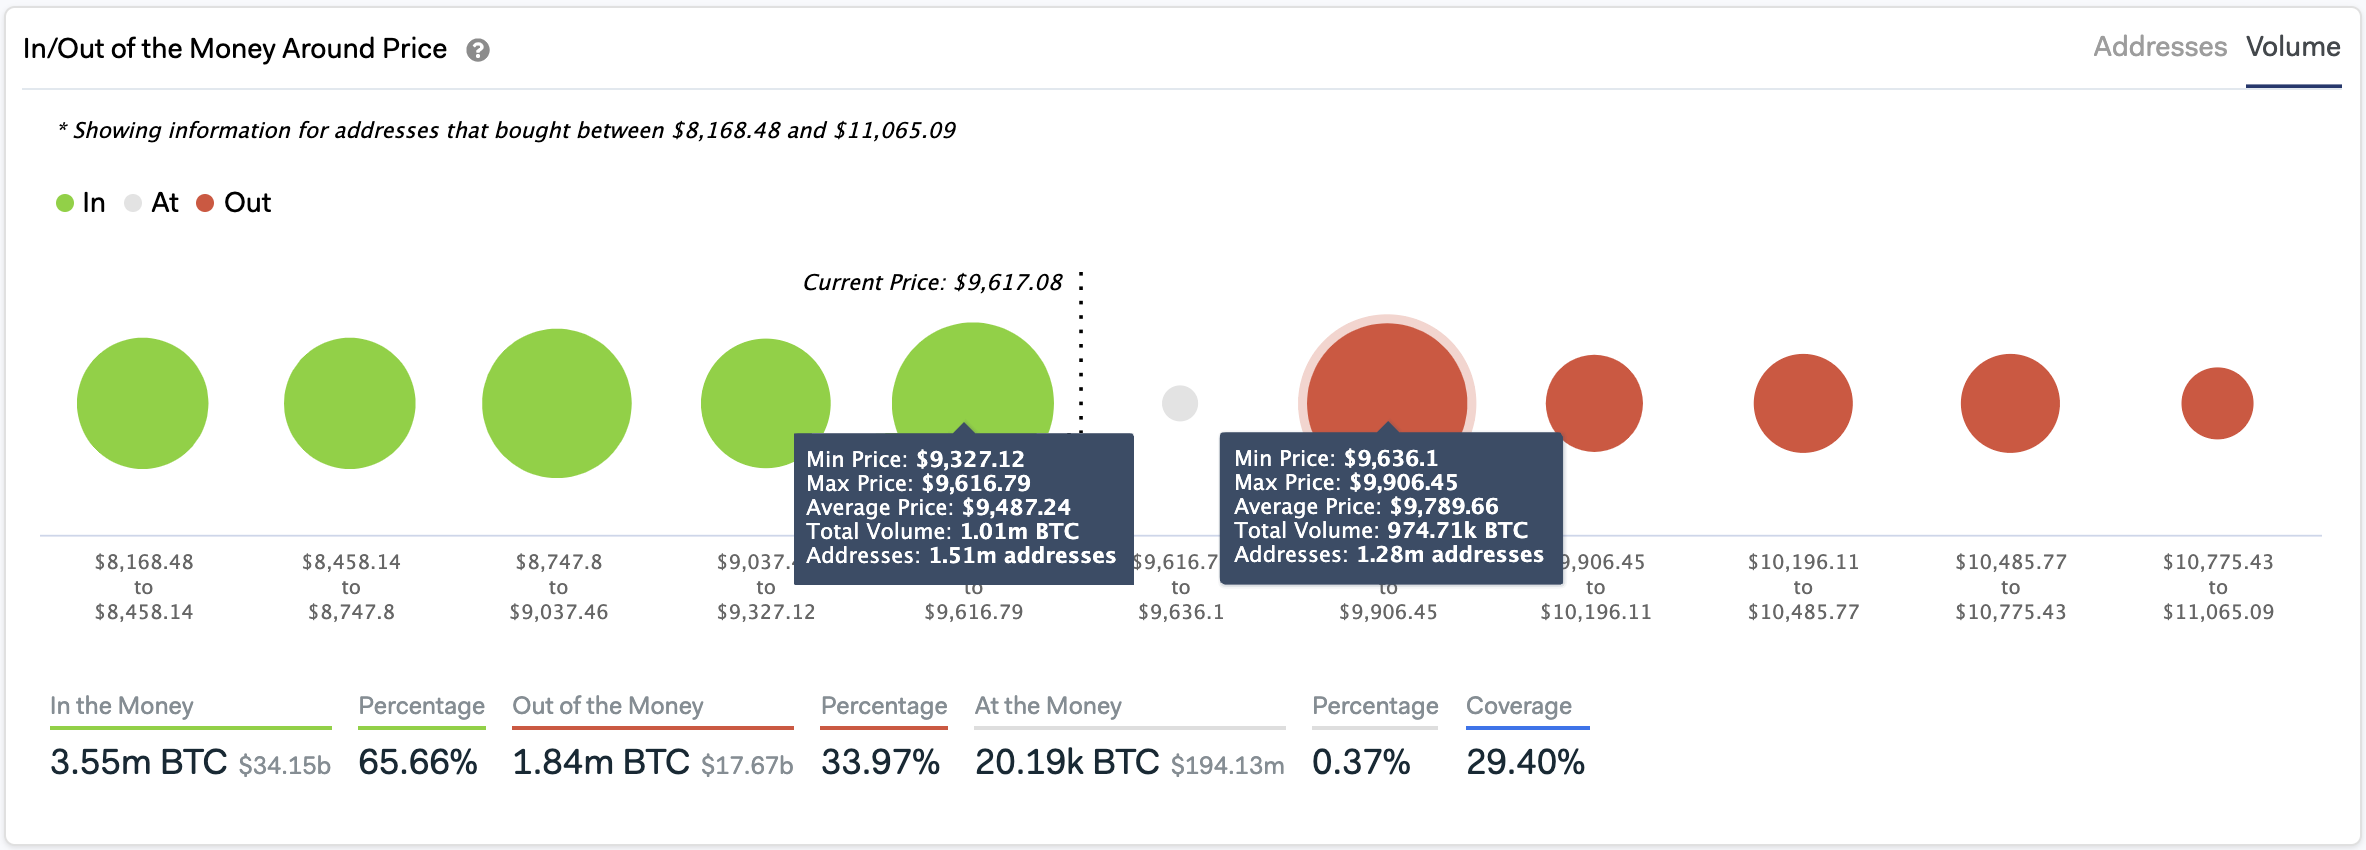
IntoTheBlock’s “In/Out of the Money Around Price” (IOMAP) model reveals that for Bitcoin to achieve its upside potential, it still needs to slice through a significant resistance barrier that lies ahead.
The critical hurdle sits between $9,640 and $9,900.
Around these price levels, roughly 1.3 million addresses bought nearly 975,000 BTC. Such a massive supply wall could prevent the pioneer cryptocurrency from further advance.
On the flip side, there is also a massive area of support underneath the price of Bitcoin. The IOMAP shows that more than 1.5 million addresses bought one million BTC between $9,300 and $9,600.
Due to the significance of the underlying support and overhead resistance, the area between these price points is a reasonable no-trade zone. Once the flagship cryptocurrency can break through any of these supply barriers, it will signal where Bitcoin is headed next.
From a technical perspective, however, the odds favor the bulls for the near term.
The recent price action sent BTC to the lower boundary of an ascending parallel channel where it has contained Bitcoin since March’s market meltdown.
If this barrier continues to hold, the price history of the past three months may repeat itself. The flagship cryptocurrency could then bounce off this support level back to the middle or towards the upper boundary of the channel at around $12,500.
An Important Sell Signal Across the Board
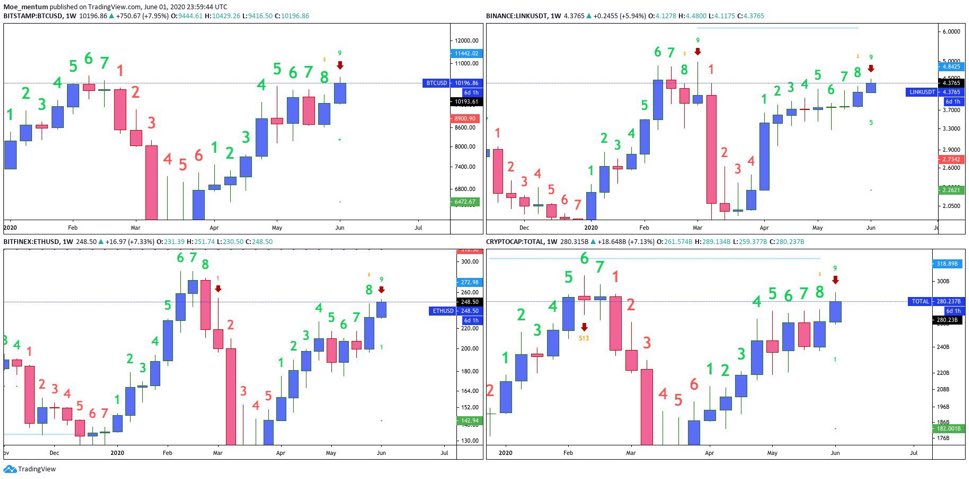
Nonetheless, the more extended time frames, such as the 1-week chart, warn that a potential downward trend is underway. Within this time frame, the TD sequential indicator is presenting a sell signal in the form of a green nine candlestick.
This bearish formation can be seen across the weekly charts of other altcoins, including Ethereum and Chainlink, as well as in the total market capitalization, affirmed trading aficionado Moe.
“Bitcoin weekly candle matters, let’s keep an eye on how BTC closes the week, current candle looks like a nice Doji at the top of the trend with perfected TD -9,” said the analyst.
A considerable increase in the sell orders behind Bitcoin could validate the signal given by the TD setup.
Under such circumstances, this technical index forecasts a one to four weekly candlesticks correction before the uptrend resumes.
For this reason, it is imperative to understand the significance of the support and resistance levels mentioned above. Now that the market might be on the cusp of its next bull cycle, having cash ready to deploy is a must.
Investors and market participants alike should remain cautious and wait for confirmation before entering any trade to avoid getting caught on the wrong side of the trend.