 Earn with Nexo

BTC / USD Price Analysis: Setting Records
Bitcoin is setting new records for the year, with indicators signaling the all clear up to $6000
- Bitcoin has a strong bullish short-term outlook, with the BTC / USD pair setting a new 2019 trading high
- Bulls are attempting to invalidate the bearish head and shoulders pattern on the four-hour time frame
- The medium-term outlook for the BTC / USD pair remains bullish
Bitcoin / USD Short-term price analysis
Bitcoin has a bullish short-term trading outlook, with buyers setting the BTC / USD pair’s new 2019 trading high.
The four-hour time frame shows that bulls are working hard to invalidate the bearish head and shoulders pattern. With bulls moving price above the previous high for 2019, technical buying in the BTC / USD pair is likely to increase.
Technical indicators on four-hour time frame have now turned bullish and are continuing to issue a strong buy signal.
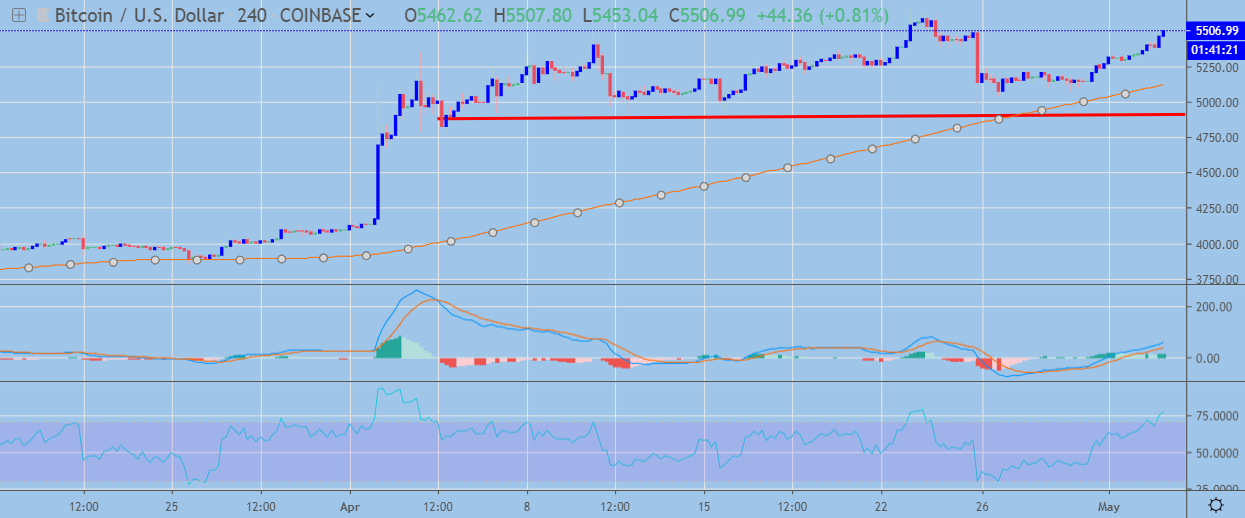 BTC / USD H4 Chart by TradingView
Pattern Watch
Traders should note that the $6,400 level is the upside objective of the invalidated head and shoulders pattern.
Relative Strength Index
The RSI indicator on the mentioned time frame is bullish, although it is approaching overbought conditions.
MACD Indicator
The MACD indicator on the four-hour time frame has turned bullish, with the MACD signal line issuing a buy signal.
Bitcoin / USD Medium-term price analysis
Bitcoin has a bullish medium-term trading outlook, with the BTC / USD pair continuing to advance above its trend defining 200-day moving average.
The daily time frame shows that the recent breakout from the falling wedge pattern is gathering upside momentum, with the $6,000 level the next major resistance area to watch above the current 2019 trading high.
Technical indicators on the daily time frame are turning higher and show scope for further upside.
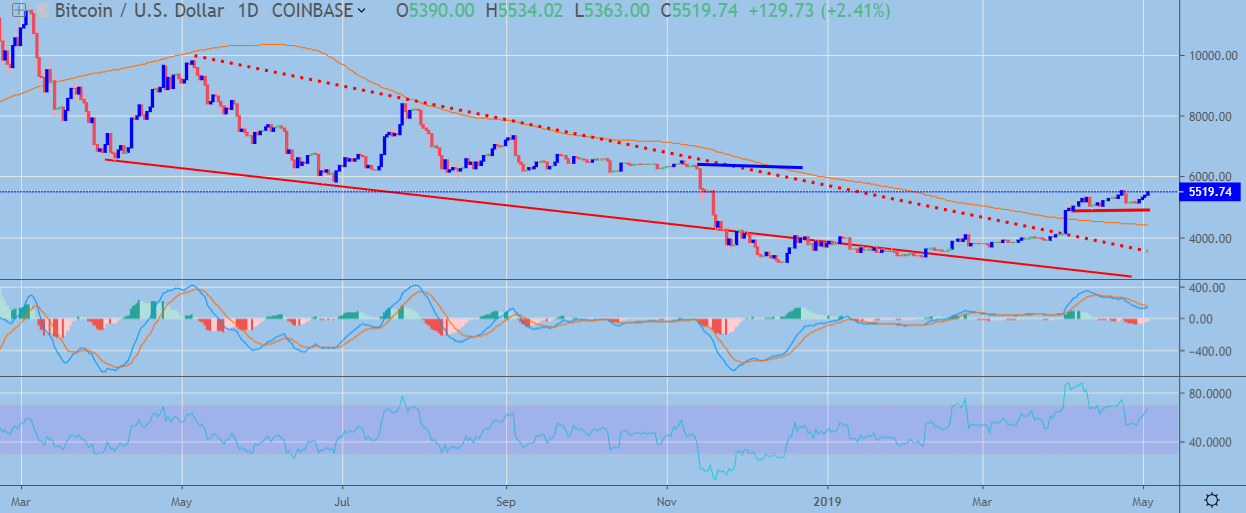 BTC / USD Daily Chart by TradingView
Pattern Watch
Traders should note that a large inverted head and shoulders pattern could start to take shape if the recent move higher gathers pace.
Relative Strength Index
The RSI indicator has turned bullish on the daily time frame and shows scope for further upside.
MACD Indicator
The MACD indicator on the daily time frame is attempting to turn bullish following the strong recovery in the BTC / USD pair.
Conclusion
Bitcoin has continued to build on its strong start to the month of May, with the BTC / USD pair advancing past the previous 2019 trading high.
The four-hour time frame shows that the cryptocurrency could trade towards the $6,400 level if the bearish head and shoulders pattern is invalidated.
In the unlikely case that you need a guide on Bitcoin, check out our coin guide.