 Earn with Nexo

Cardano / USD Technical Analysis: Lifting Above The Clouds
ADA / USD Technical Analysis - This is the first time Cardano has broken above its 200-day moving average since June last year.
[vc_row][vc_column][vc_column_text]
- Cardano has a bullish short-term bias, with price trading at its highest level since November 2018
- The four-time frame shows that a bullish inverted head and shoulders pattern is in play
- The medium-term outlook is bullish, with Cardano trading above its 200-day moving average for the first time since May 2018
Cardano / USD Short-term price analysis
Cardano has a bullish short-term trading bias, with the cryptocurrency advancing towards levels not seen since November of last year.
A bullish inverted head and shoulders pattern is in play across the four-hour time frame, with the November 2018 trading high the overall bullish objective of the pattern.
Technical indicators on the four-hour time frame are also generating a bullish signal.
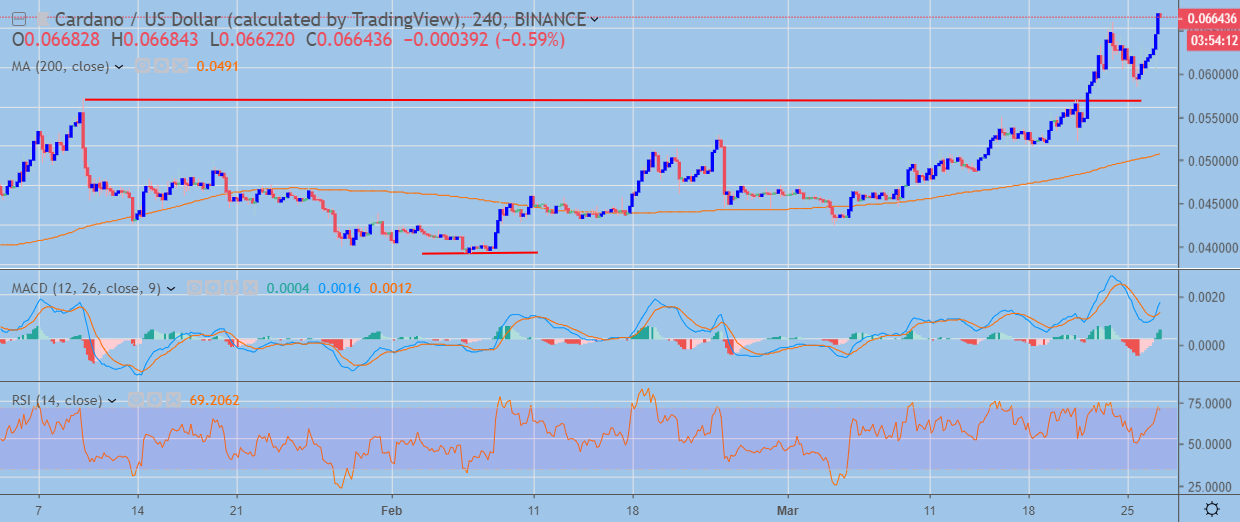 ADA / USD H4 Chart (Source: TradingView)
Pattern Watch
Traders should note that an even larger inverted head and shoulders pattern will take shape if price reaches the November 2018 trading high.
Relative Strength Index
The RSI indicator is also bullish on the four-hour time frame.
MACD Indicator
The MACD indicator on the four-hour time frame has turned bullish and is currently generating a strong buy signal.
Cardano / USD Medium-term price analysis
Cardano has a bullish medium-term bias, with the cryptocurrency trading above its trend defining 200-day moving average for the first time since May 2018.
The daily time frame shows that since the bullish breakout from the sideways price channel earlier this month, the ADA / USD pair has continued its steady advance.
Technical indicators on the daily time frame are bullish, although they are starting to appear overstretched.
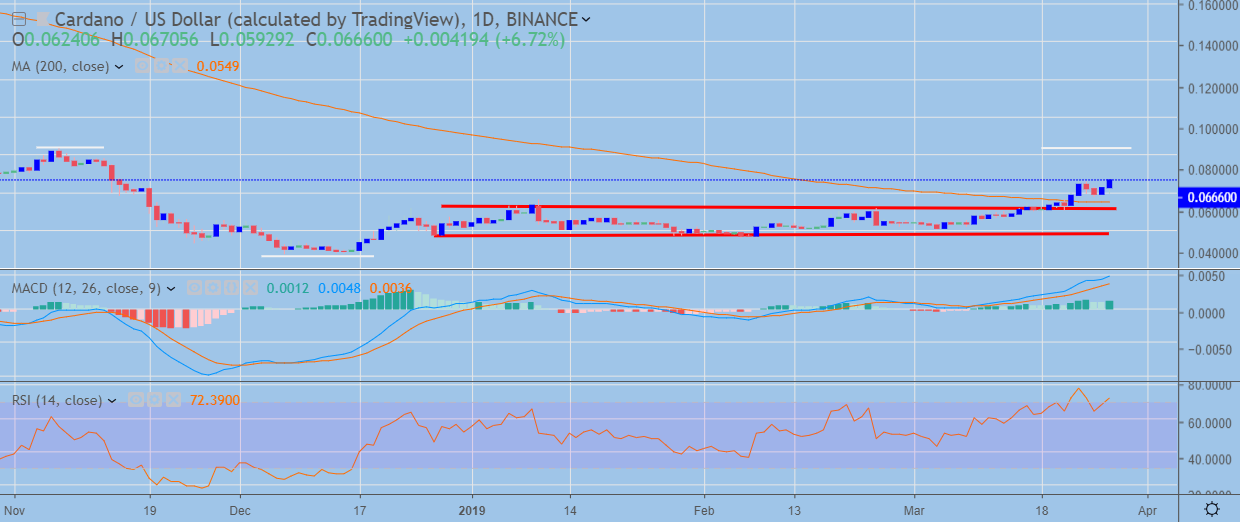 ADA / USD Daily Chart (Source: TradingView)
Pattern Watch
The daily time frame is also showing that a large inverted head and shoulders pattern will start to take shape if the recent advance reaches the November trading high.
Relative Strength Index
The RSI indicator remains bullish on the daily time frame, although the indicator is approaching overbought conditions.
MACD Indicator
The MACD indicator remains bullish on the daily time frame, although the MACD signal line appears overstretched.
Conclusion
Cardano is growing increasingly bullish, with the breakout move above its 200-day moving average the latest sign that the cryptocurrency maybe intending to test higher over the medium-term.
A large inverted head and shoulders pattern will form on both time horizons if the bullish pattern on the four-hour time frame reaches its full upside target.
To read a brief explanation of what Cardano is all about, check out our coin guide here.
For the more analytic-minded, our DARE provides a detailed review of the investment-grade of the project.
Decentral Media, Inc., the publisher of Crypto Briefing, is not an investment advisor and does not offer or provide investment advice or other financial advice. Nothing on this website constitutes, or should be relied on as, investment advice or financial advice of any kind. Specifically, none of the information on this website constitutes, or should be relied on as, a suggestion, offer, or other solicitation to engage in, or refrain from engaging in, any purchase, sale, or any other any investment-related activity with respect to any transaction. You should never make an investment decision on an investment based solely on the information on our website, and you should never interpret or otherwise rely on any of the information on this website as investment advice. We strongly recommend that you consult a licensed investment advisor or other qualified financial professional if you are seeking investment advice on an investment.
[/vc_column_text][/vc_column][/vc_row]