 Earn with Nexo

Cardano Price Analysis ADA / USD: Racing To A 2019 High
Large head and shoulder patterns dominate the outlook.
- Cardano has a bullish short-term trading outlook, with the cryptocurrency briefly advancing to a fresh 2019 trading high
- The four-hour time frame is showing that complex inverted head and shoulders pattern is unfolding
- The daily time frame is showing that a huge bullish pattern continues to take shape on the daily time frame
Fundamental Analysis
ADA price is currently holding strong in anticipation of the Shelley upgrade. Recently, the project announced the release of the testing program, the first step in the rollout of the Shelley testnet. It will allow users to start testing Cardano staking mechanisms that will be used in the upcoming upgrade.
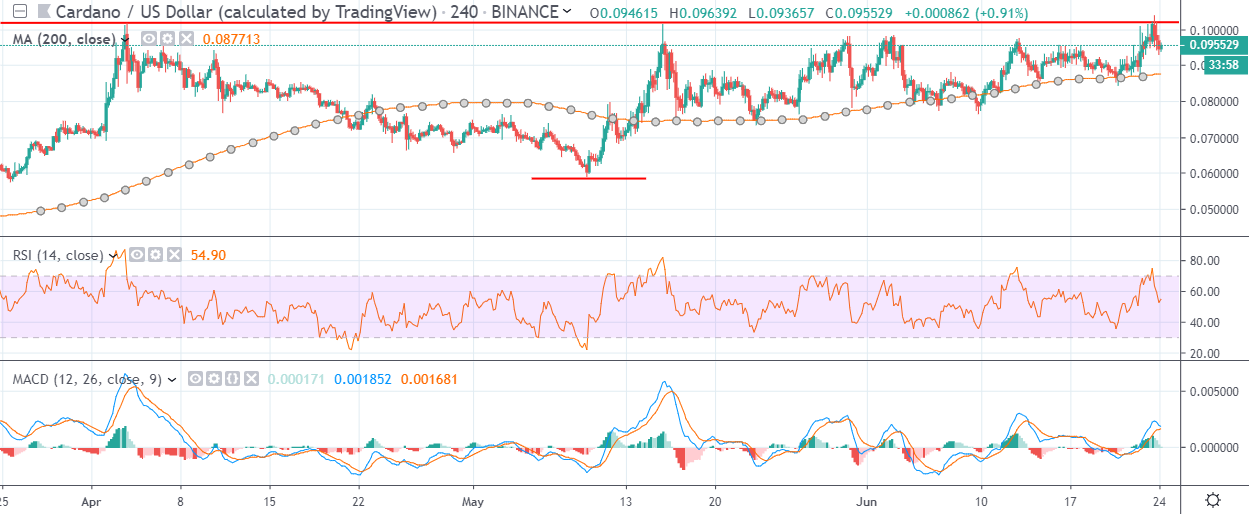
Cardano / USD Short-term price analysis
Cardano has a bullish short-term trading outlook, with the cryptocurrency briefly advancing to a fresh 2019 price high.
The four-hour time frame is showing that a complex inverted head and shoulders pattern continues to take shape, with bulls repeatedly failing to ignite the bullish pattern.
Technical indicators on the four-hour time frame are starting to turn lower as upside price exhaustion weighs on the ADA / USD pair.
Pattern Watch
Traders should note that repeated technical failure around neckline resistance may provoke an important test of the ADA / USD pair’s 200-period moving average.
Relative Strength Index
The RSI indicator on the four-hour time frame is turning lower and fast approaching neutral conditions.
MACD Indicator
The MACD indicator on the four-hour time frame is attempting to turn bearish as short-term selling pressure builds.
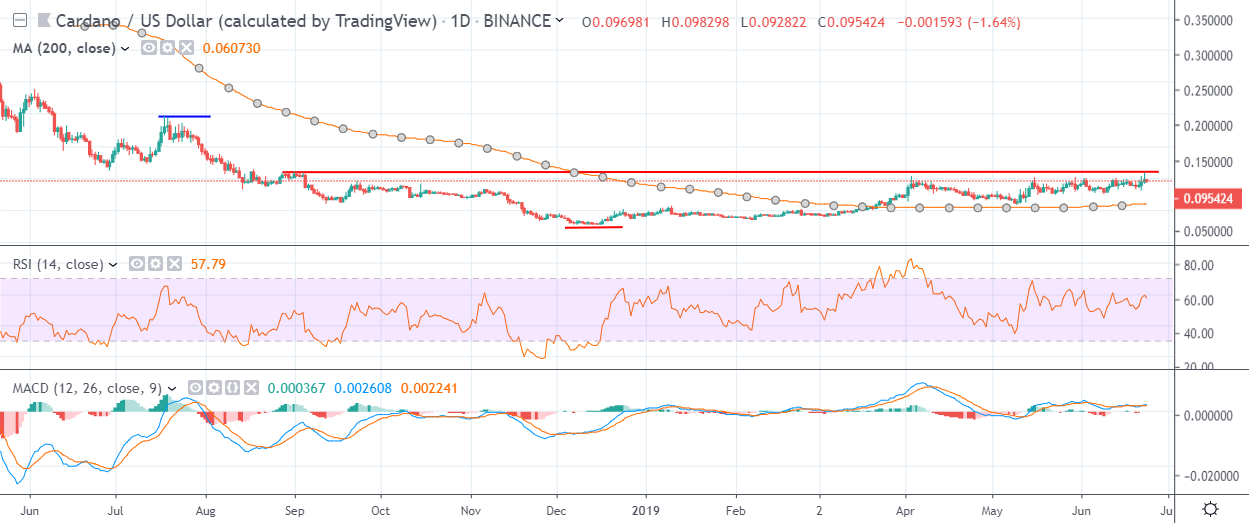
Cardano / USD Medium-term price analysis
Cardano has a bullish medium-term trading outlook, with the cryptocurrency recently testing towards major resistance on the daily time frame.
The daily time frame is showing that an extremely large inverted head and shoulders pattern has formed, with the ADA / USD pair consolidating below neckline resistance.
Technical indicators on the daily time frame are bullish and still show scope for further upside.
Pattern Watch
Traders should note that the July 2018 trading high is the overall bullish target of the large inverted head and shoulders pattern on the daily time frame.
Relative Strength Index
The RSI indicator is bullish on the daily time frame and still has scope to trade higher.
MACD Indicator
The MACD indicator on the daily time frame is bullish, although it is issuing a fairly weak buy signal.
Conclusion
The recent move higher in the ADA / USD pair has helped to complete the formation of an extremely large bullish pattern on the daily time frame with significant upside potential.
While Cardano’s medium-term credentials are undoubtedly bullish, the four-hour time frame is warning of a deeper correction lower if buyers continue to fail around neckline resistance.
Check out our coin guide for the Cardano project.
Cardano also received the DARE treatment, a full analysis of its merits and challenges.