 Earn with Nexo

Cardano Price Analysis ADA / USD: Taking The Leap
ADA might make a decisive directional move this week.
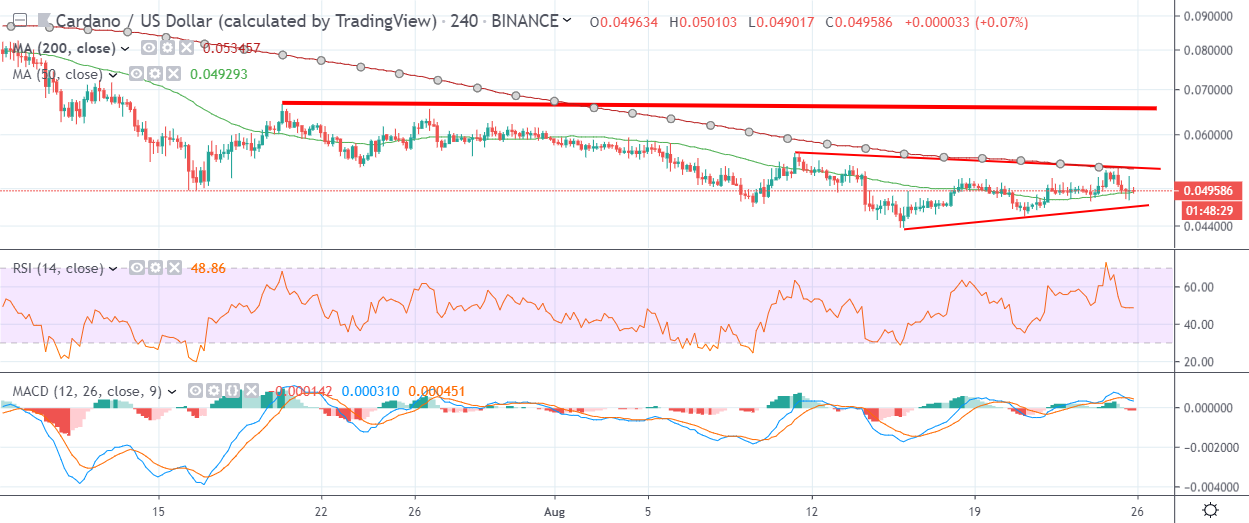
- Cardano is preparing for a short-term technical breakout from a neutral triangle pattern on the four-hour time frame
- The popular cryptocurrency remains technically weak across the medium-term horizon
Cardano has opened the new trading weaker under renewed downside pressure and is currently the worst performing cryptocurrency inside the top twenty cryptocurrencies by market capitalization. The ADA / USD pair has also remained below its trend defining 200-day moving average for over forty days.
After finding strong technical support around the $0.043000 level on August 16th Cardano advanced back towards the $0.053000 level last week, before slipping back. The recent recovery has so far lacked volume and the overall intensity of the March and April rally in the cryptocurrency, which is mainly due to weak sentiment across the altcoin space.
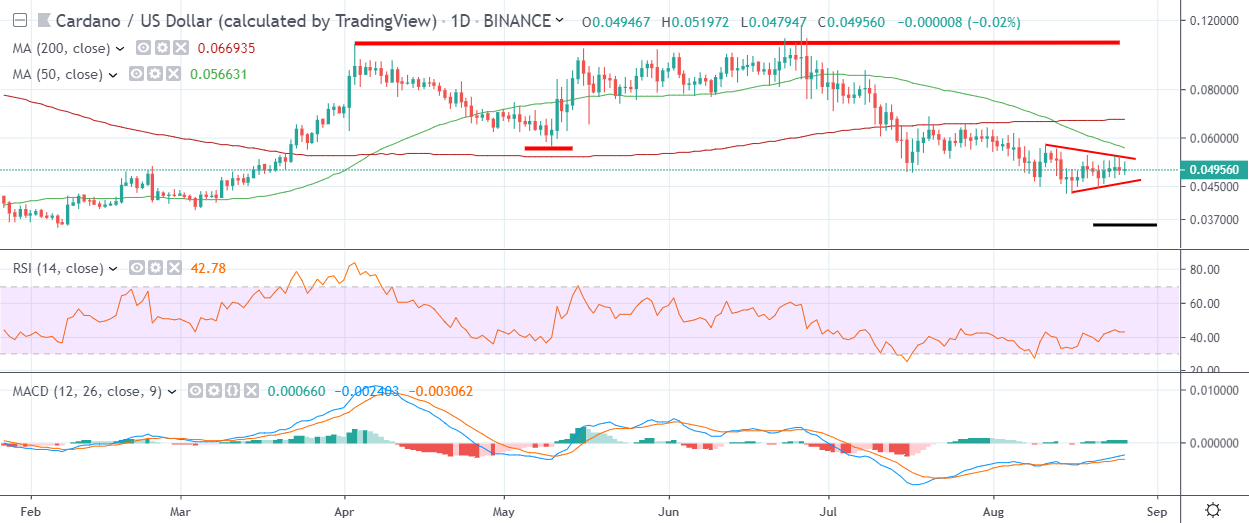
From a technical perspective, the ADA / USD pair still has scope to turn lower, despite eroding over fifty of its value since its June 26th peak. The daily time frame is still showing that the technical landscape is heavily bearish, while the four-hour time frame shows glimmers of hope for the cryptocurrency.
The daily time frame shows a bearish death cross underway, and the ADA / USD pair still trading below an invalidated inverted head and shoulders pattern. The four-hour time frame shows that price is consolidating inside a neutral triangle pattern, although a strong rally could help to shape a potential inverted head and shoulders pattern.
According to the latest sentiment data from TheTIE.io, the short-term sentiment towards Cardano is surprisingly positive, at 64.00 %, while the overall long-term sentiment towards the cryptocurrency is bearish, at 38.00%.
Upside Potential
The four-hour time frame is showing that if bulls can perform a bullish breakout above the top of the triangle pattern, at $0.054000, the ADA / USD could rally towards the $0.067000 level and form a bullish inverted head and shoulders pattern, with a $0.020000 upside projection.
The daily time frame highlights that the medium-term technical landscape is still extremely bearish, with bulls needing to move price above dual resistance, at $0.057000, to stabilize the ADA / USD pair.
Downside Potential
The downside potential for the ADA / USD pair is focused around the $0.046000 level on the four-hour time frame, if we see a bearish triangle breakout. A move below the $0.046000 level is likely to prompt the cryptocurrency to fall to a new 2019 trading low.
The daily time frame is also highlighting that a large inverted head and shoulders pattern has been invalidated, with the overall downside target of the bearish invalidation located around the $0.036000 level.
Summary
Cardano is likely to make a decisive directional move this week, with the trading action solely focused around the triangle pattern on the four-hour time frame.
A bullish breakout from the triangle suggests that Cardano could start to see a much-needed technical recovery back towards at least the $0.057000 level, while a bearish breakout is likely to prompt a test of the $0.036000 level.
Check out our coin guide for the Cardano project.
Cardano also received the DARE treatment, a full analysis of its merits and challenges.