
Cardano / USD Technical Analysis: Reaching Price Target
ADA / USD Technical Analysis - Cardano has seen a monumental rise in the last month, but indicators show it may be close to the end.
[vc_row][vc_column][vc_column_text]
- Cardano has a strong bullish short-term bias, with the cryptocurrency adding close to sixty percent to its value this month
- The medium-term outlook remains bullish for the ADA / USD pair, with the daily chart showing an inverted head and shoulders pattern in play
- Both time frames show bearish MACD price divergence
Cardano / USD Short-term price analysis
Cardano has a bullish short-term trading bias, with the cryptocurrency adding close to sixty percent to its value so far this month.
The bullish inverted head and shoulder pattern on the four-hour time frame has now been triggered, with the November 12th, 2018 trading high being the pattern’s overall upside target.
Technical indicators are showing bearish MACD price divergence across the four-hour time frame.
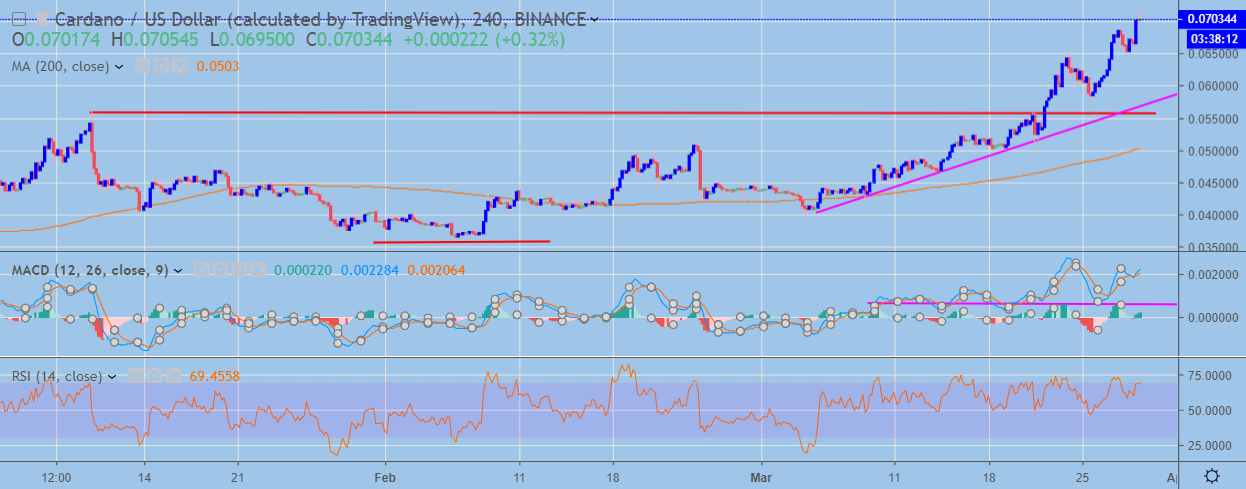 ADA / USD H4 Chart (Source: TradingView)
Pattern Watch
Traders should note that the inverted head and shoulders patterns on the four-hour time frame is nearing completion.
Relative Strength Index
The RSI indicator is also bullish on the four-hour time frame, although it is approaching overbought territory.
MACD Indicator
The MACD indicator on the four-hour time frame has turned bullish, although bearish MACD price divergence is now evident.
Cardano / USD Medium-term price analysis
Cardano has a bullish medium-term trading bias, with the cryptocurrency building bullish trading momentum above its 200-day moving average.
The daily time frame shows an inverted head and shoulders pattern in progress, with the peaks of November 2018 the likely upside target of the bullish pattern.
Technical indicators on the daily time frame show bearish RSI and MACD price divergence.
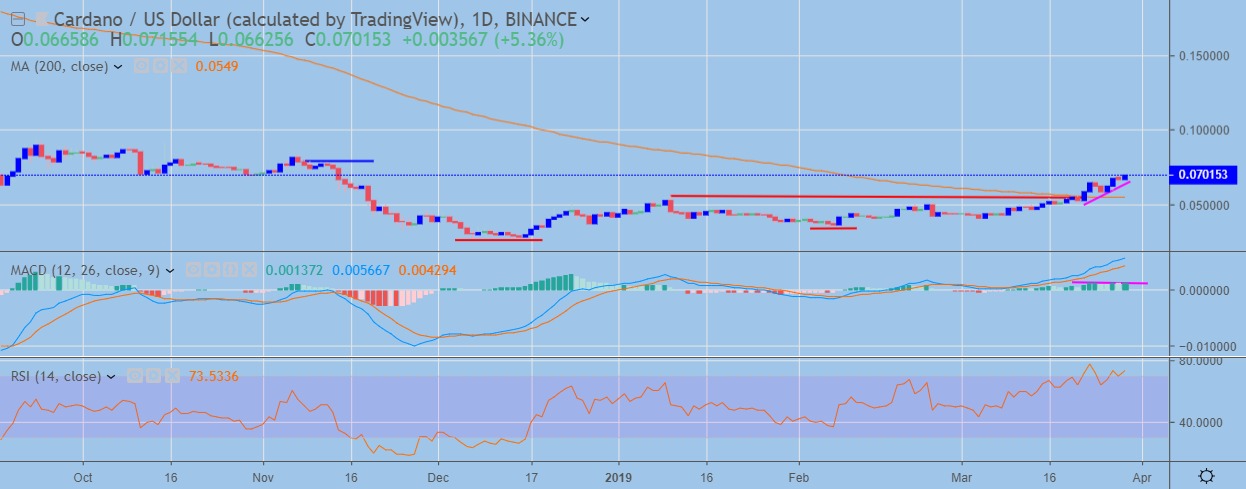 ADA / USD Daily Chart (Source: TradingView)
Pattern Watch
Traders should note that a much larger inverted head and shoulders pattern will start to take shape if the pattern reaches its overall upside objective.
Relative Strength Index
The RSI indicator remains bullish on the daily time frame, although is it failing to make new highs alongside price.
MACD Indicator
The MACD indicator on the daily time frame is conflicted, with the MACD signal line rising while the MACD histogram is lagging behind price.
Conclusion
Cardano continues its strong monthly advance, with the cryptocurrency adding close to sixty percent to its value this month, whilst also gaining confidence above its 200-day moving average.
The ADA / USD pair is likely to reach the overall upside target of the bullish inverted head and shoulders pattern, although caution is advised as both time frames are starting to show bearish MACD price divergence.
For a quick guide to understand Cardano we wrote a coin guide available here.
A thorough report is available in our DARE analysis of the Cardano project.
Decentral Media, Inc., the publisher of Crypto Briefing, is not an investment advisor and does not offer or provide investment advice or other financial advice. Nothing on this website constitutes, or should be relied on as, investment advice or financial advice of any kind. Specifically, none of the information on this website constitutes, or should be relied on as, a suggestion, offer, or other solicitation to engage in, or refrain from engaging in, any purchase, sale, or any other any investment-related activity with respect to any transaction. You should never make an investment decision on an investment based solely on the information on our website, and you should never interpret or otherwise rely on any of the information on this website as investment advice. We strongly recommend that you consult a licensed investment advisor or other qualified financial professional if you are seeking investment advice on an investment.
[/vc_column_text][/vc_column][/vc_row]