Chainlink Marines “Buy the Dip,“ Anticipating New All-Time Highs
Over $1 billion in Bitcoin futures were liquidated over the past few hours as the entire crypto market crashed. Still, LINK holders seem to have taken advantage of the low prices to add more tokens to their positions.
Chainlink’s uptrend has not been interrupted by the recent crypto market crash. Sidelined LINK investors appear to have bought the dip, which may lead to a further advance.
LINK Investors Buy the Dip
The past ten hours have been dramatic for LINK holders.
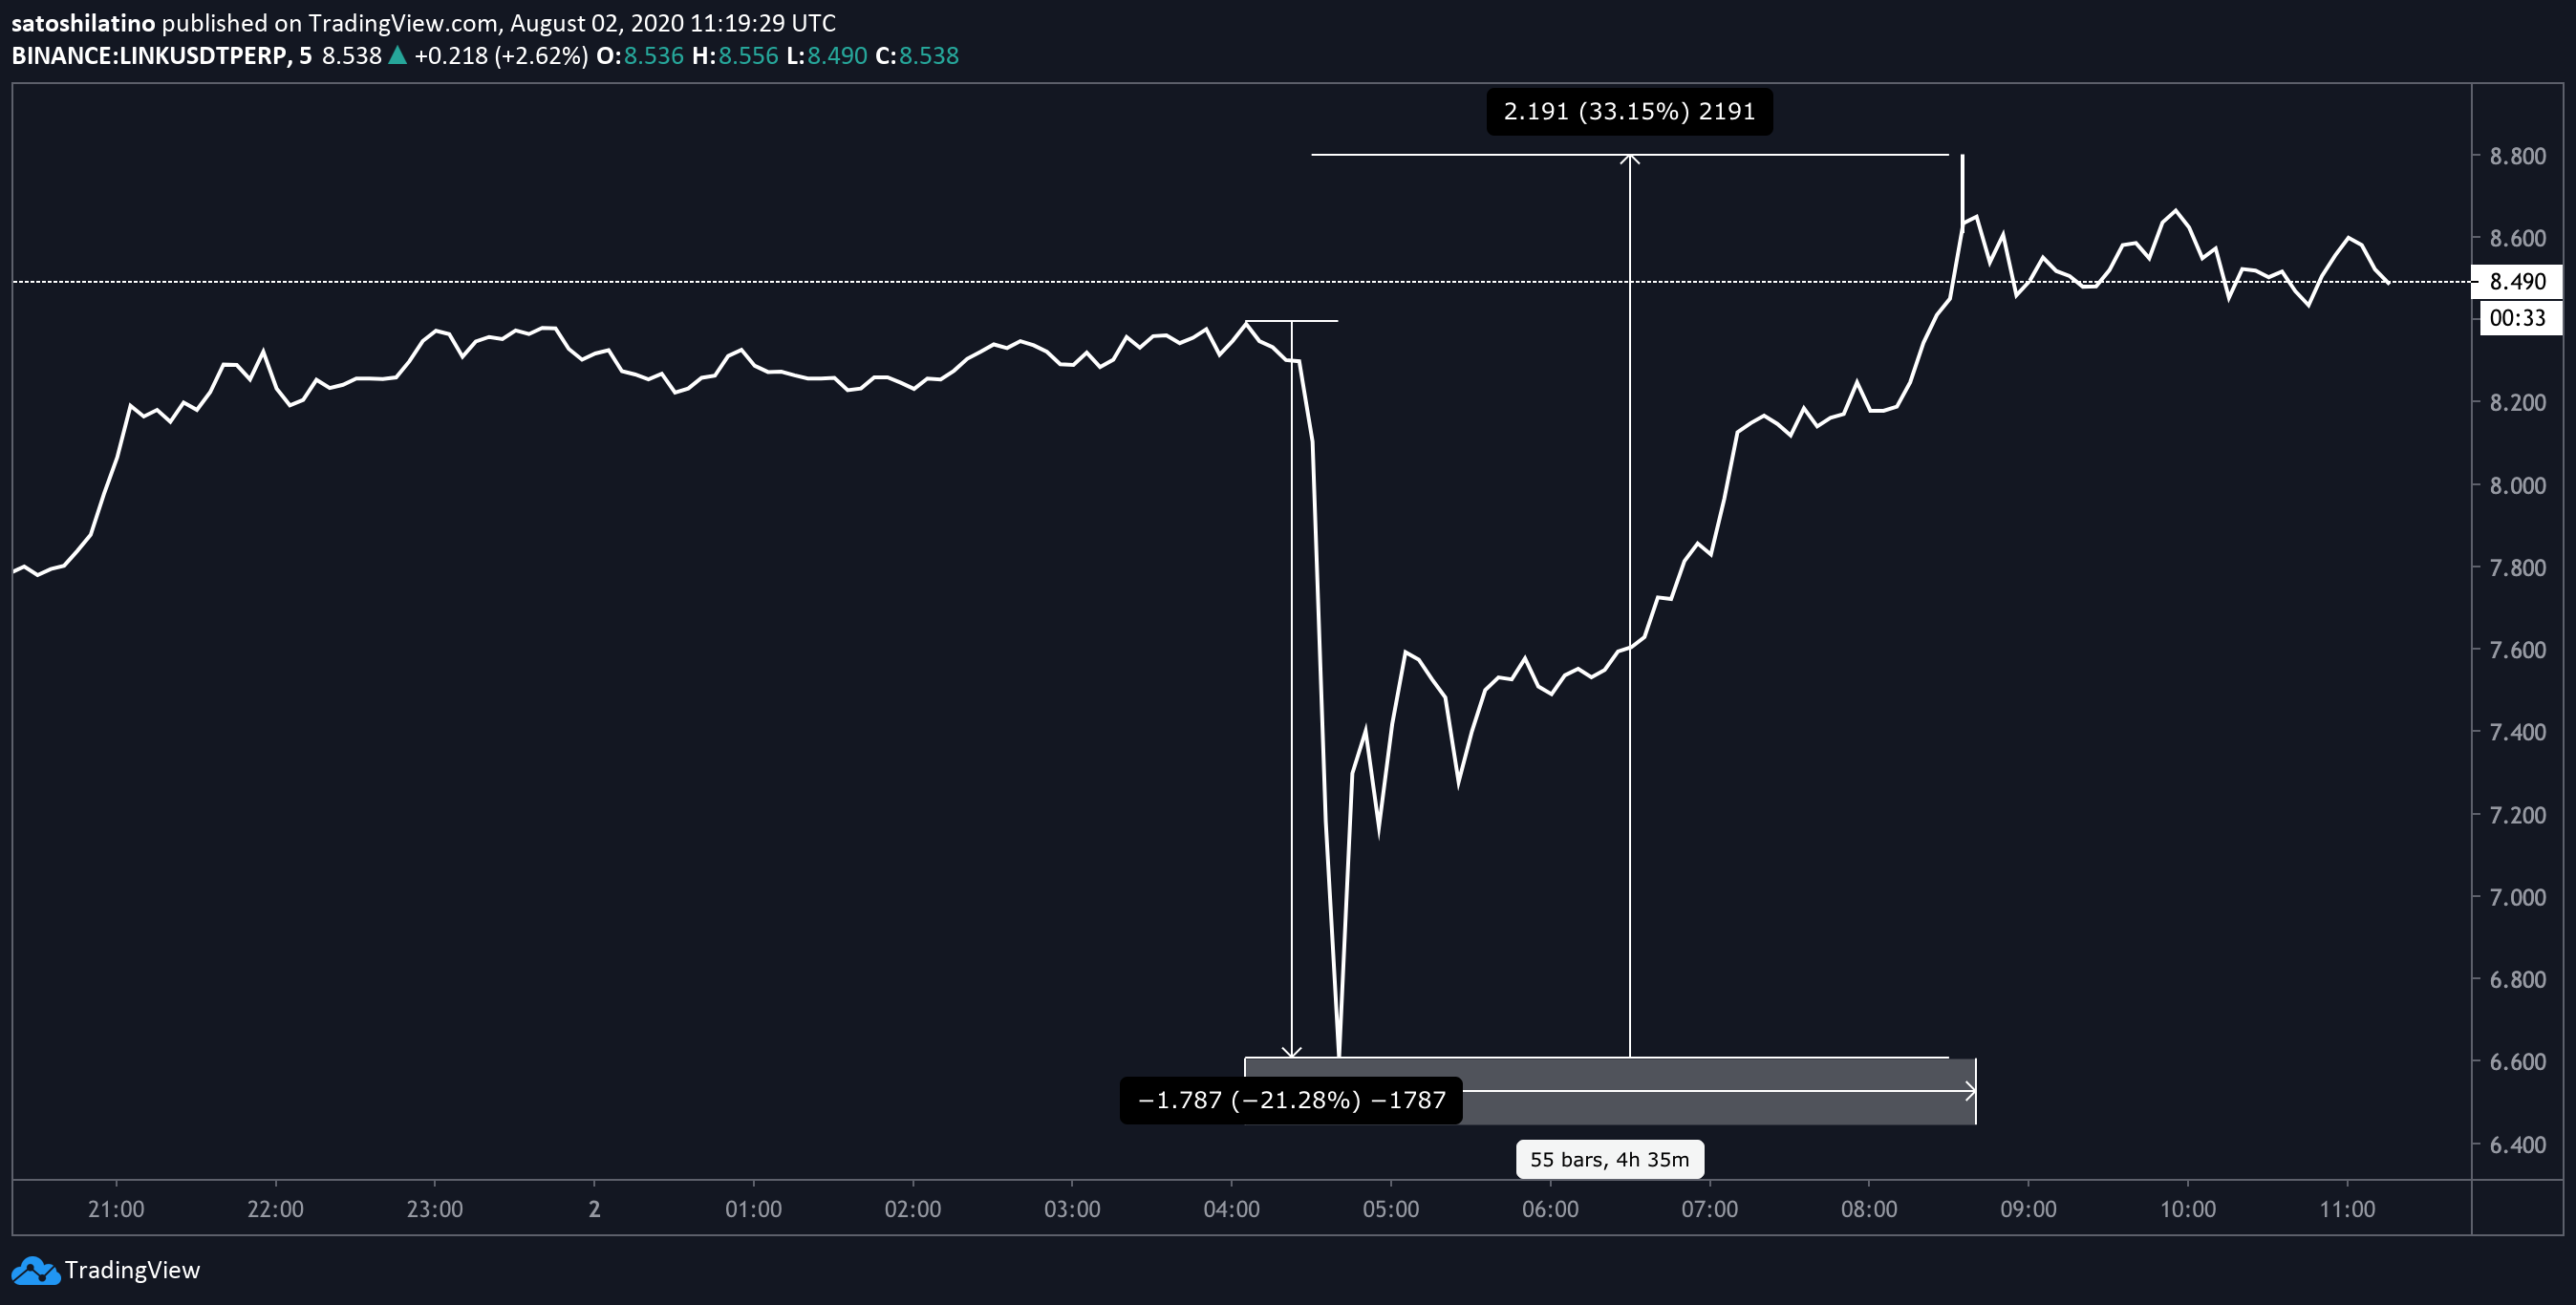
This cryptocurrency rose to a high of $8.5 on Aug. 1, but a few hours after the daily close, the crypto market crashed, taking Chainlink down with it. The decentralized oracles token took a 21% nosedive within 30 minutes, dropping to a low of $6.6.
Regardless of the erratic price action, investors appear to have taken advantage of it to accumulate more tokens.
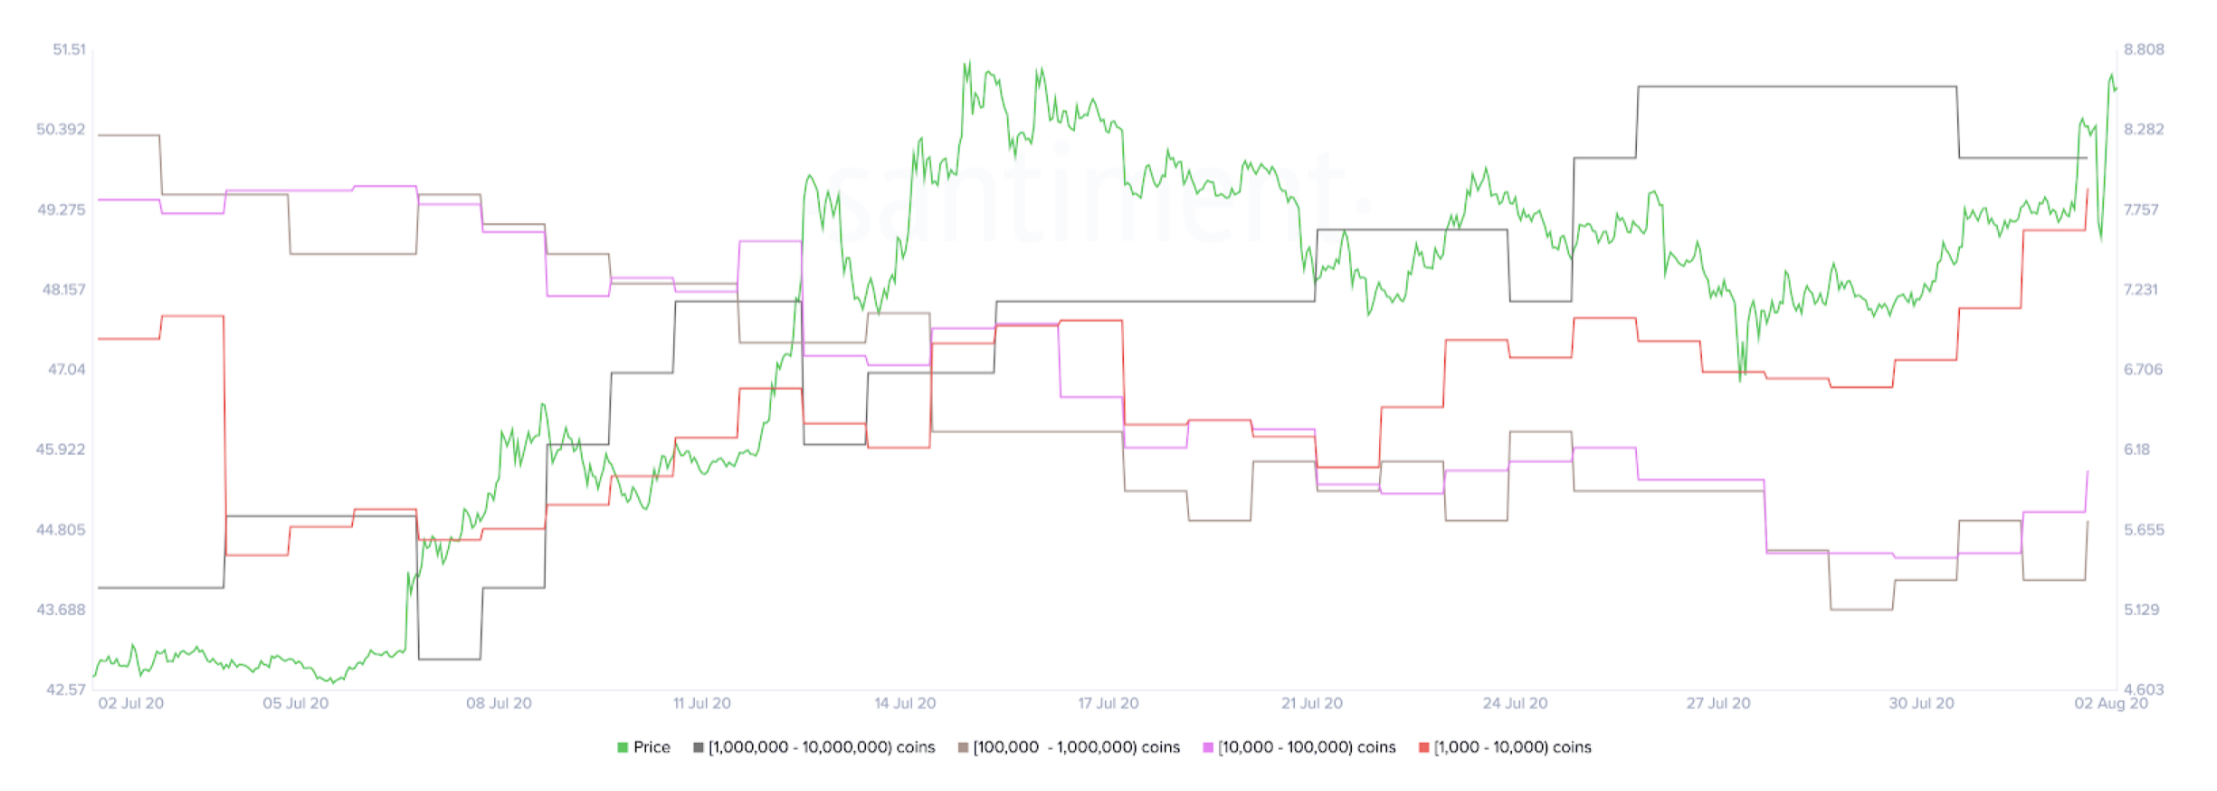
Santiment’s holder distribution chart shows that as prices dropped, the buying pressure behind Chainlink surged substantially. The behavioral analytics firm registered a spike in the number of addresses holding between 1,000 and 10 million LINK.

As sidelined investors entered the market, prices were able to recover quickly. Consequently, LINK rebounded, soaring over 33% to make a higher high of $8.8.

Chainlink Aims for New Yearly Highs
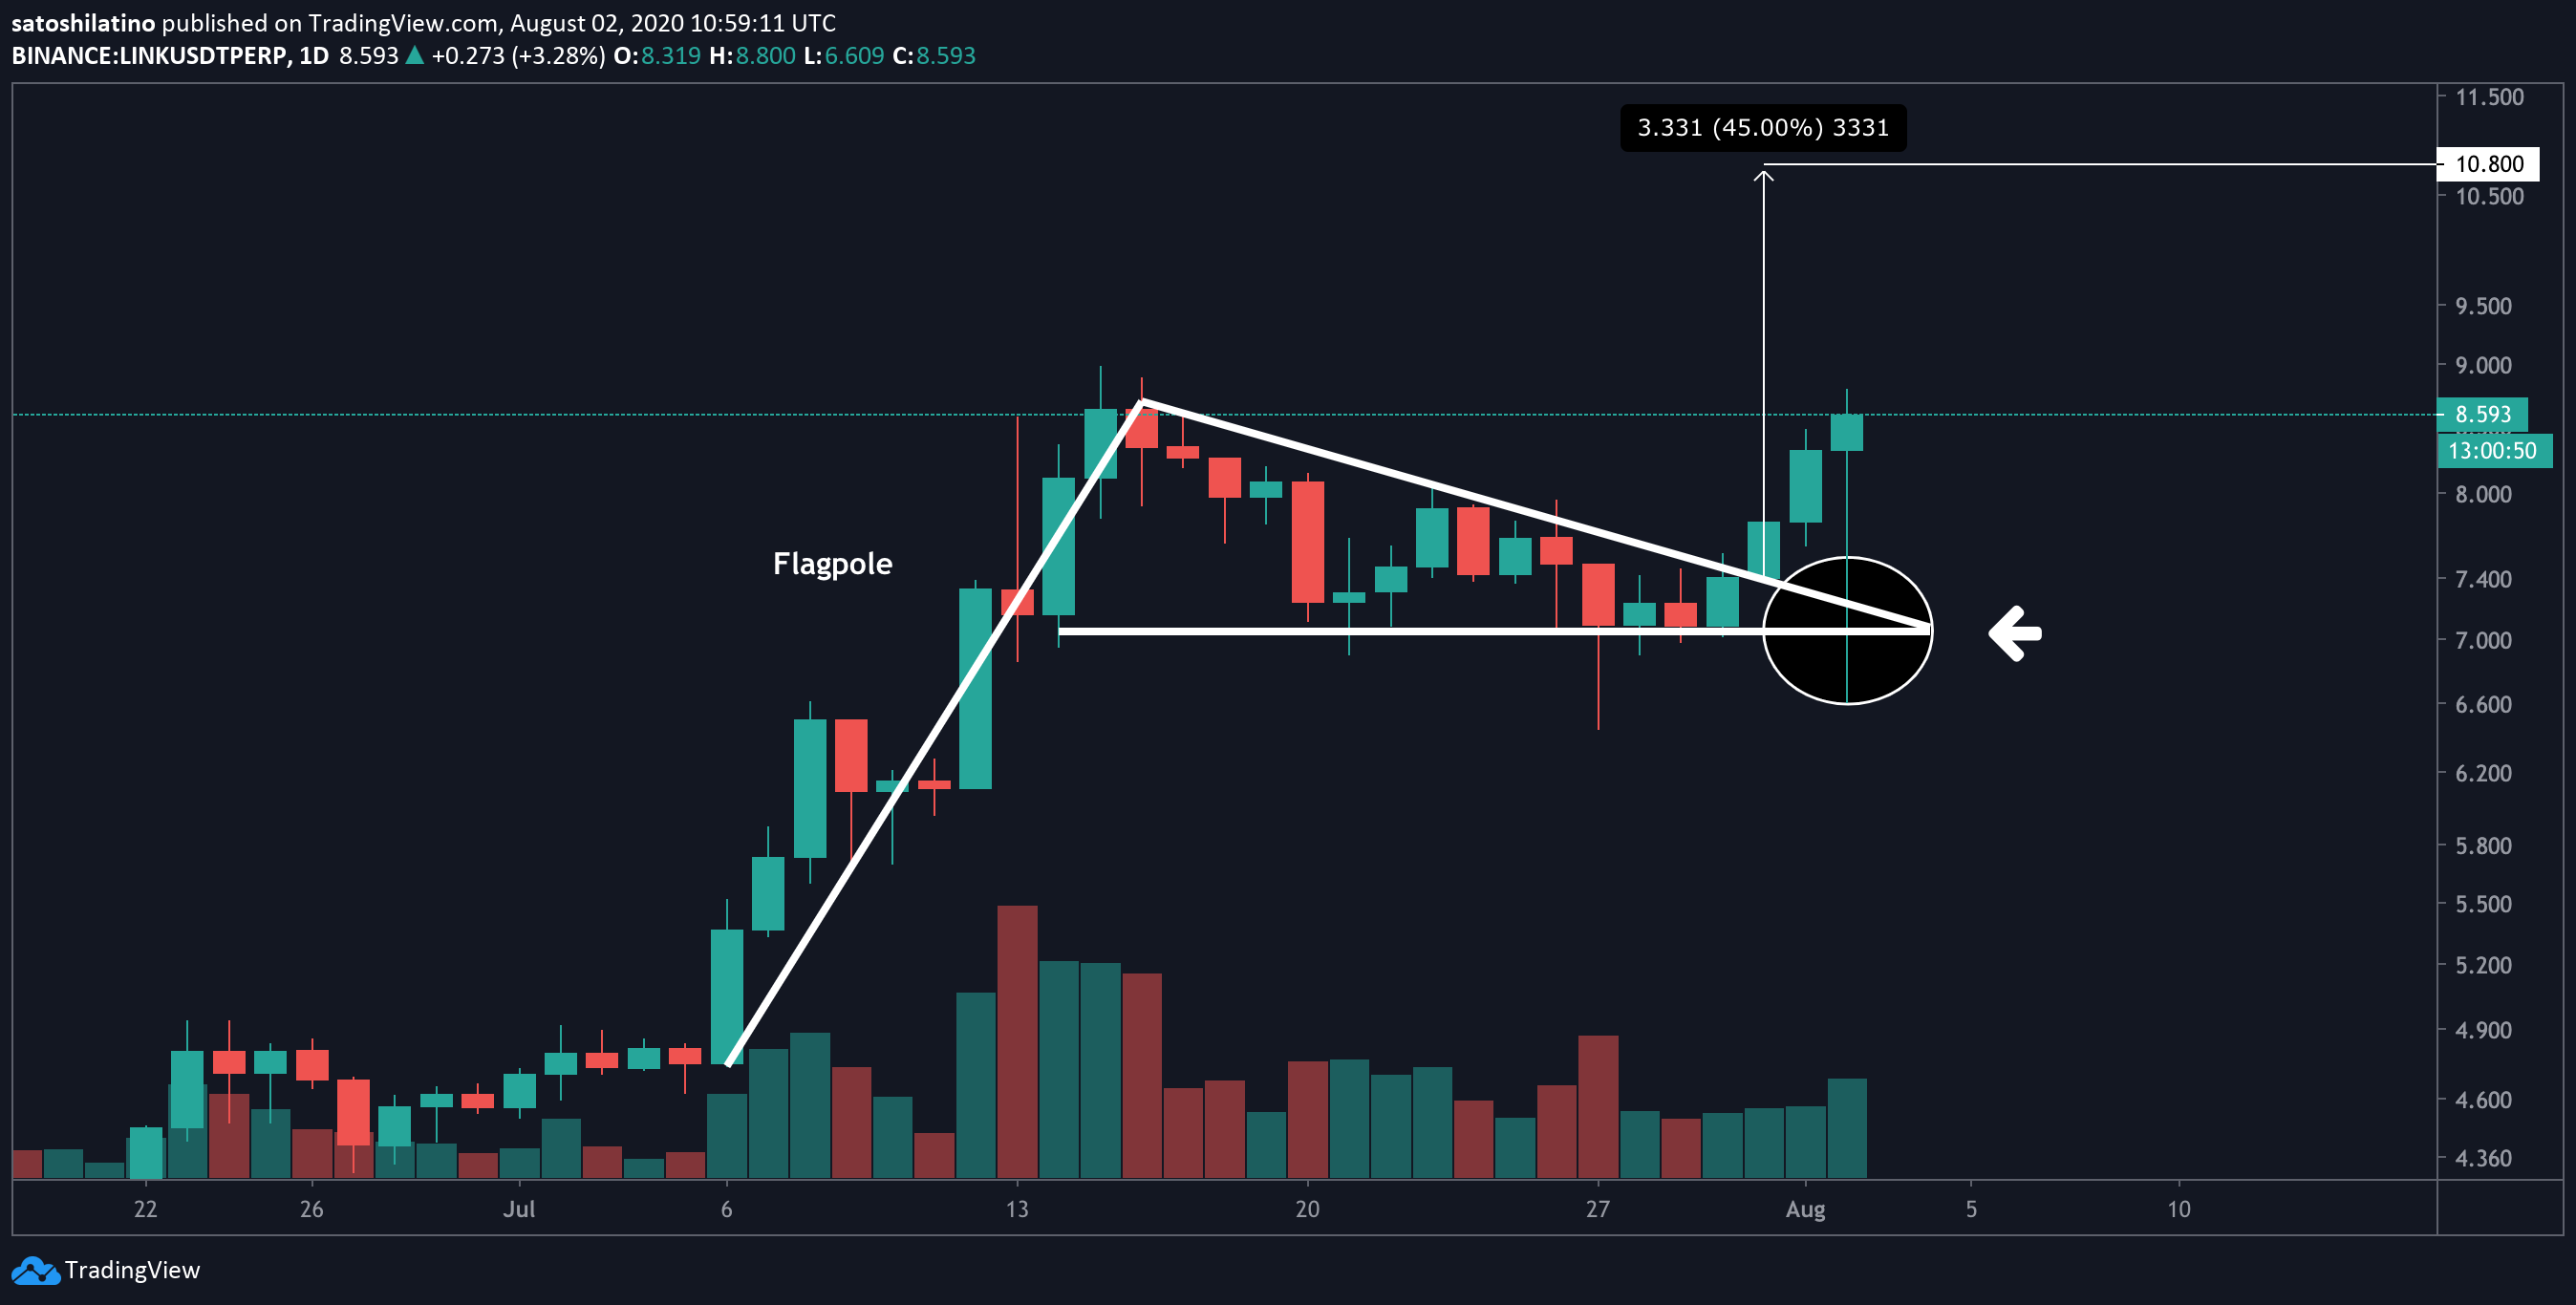
When looking at LINK’s 1-day chart, it seems like its price bounced off the x-axis of a descending triangle. This technical formation is part of a bull flag that has been developing within this time frame since early July.
Although the new levels of volatility around Chainlink could have flushed out weak hands, it might be preparing to continue its uptrend. A further spike in demand for this altcoin may see it rise towards $11.
This target is determined by measuring the height of the flagpole and adding it to the breakout point.

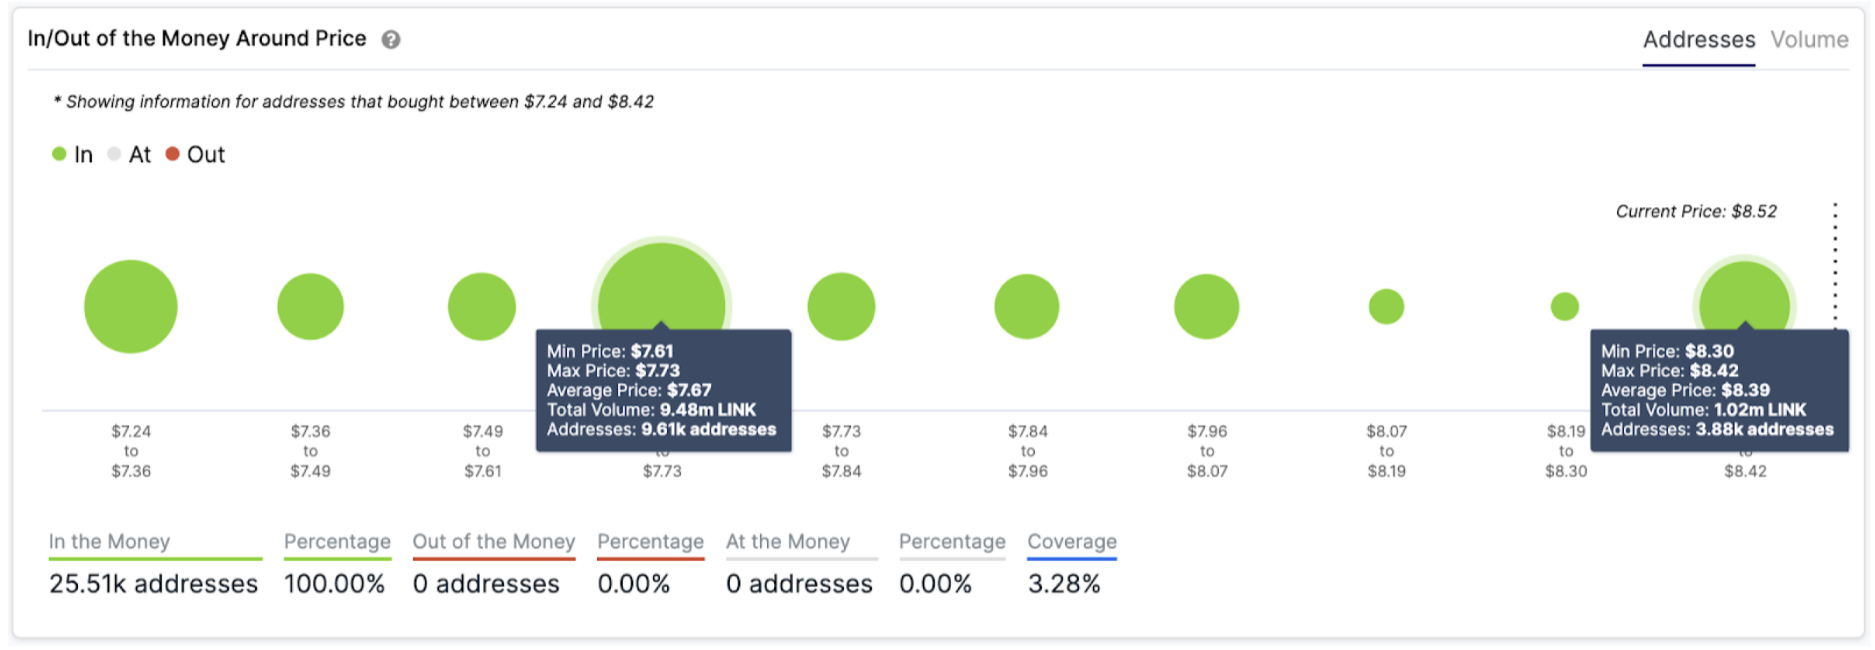
IntoTheBlock’s “In/Out of the Money Around Price” (IOMAP) model reveals that there isn’t any supply barrier ahead of this cryptocurrency that will prevent it from reaching its upside potential. Conversely, this on-chain metric suggests that several areas of interest may hold in the event of a correction.
Based on the IOMAP cohorts, the $7.7 support level might be able to absorb any downward pressure. Approximately 9,600 million addresses had previously purchased 9.5 million LINK around this level.
Holders within this price range would likely try to remain profitable in their long positions and buy more tokens to allow prices to rise as they did recently.

Given the recent levels of volatility, it is imperative to implement a robust risk management strategy when trading Chainlink or any other cryptocurrency. Now that the market seems to have entered a new bullish cycle, having cash ready to deploy is a must.
