
Chainlink Gunning for All-Time Highs, Stiff Resistance Ahead
Chainlink appears to have shrugged off the FUD around LINK as technicals suggest that it is about to breakout to new all-time highs.
Chainlink is ready to resume its uptrend after suffering a two-week decline that gutted LINK prices by 28%. The charts show that Chainlink is gunning for all-time highs, but there’s stiff resistance it first needs to break.
Chainlink Aims for New All-Time Highs
After reaching an all-time high of nearly $9 on July 15, Chainlink entered a two-week corrective phase. During which, the price of LINK dropped by more than 28% to hit a low of $6.4.
The downward price action appears to have been predicted by the TD sequential indicator, which presented a sell signal on LINK’s 3-day chart. Now that the corrective phase appears to be over, the decentralized oracles token formed a bull flag on its daily chart. The 90% rally that took place within the first half of the month created the flagpole. Meanwhile, the descending triangle that developed since then formed the flag.
This technical pattern forecasts that upon the breakout point Chainlink could surge by 46%.
Such an impressive upwards target is determined by measuring the height of the flagpole and adding it to the breakout point. And here, the flagpole is massive.
Tough Supply Wall Ahead
In the event of a breakout, IntoTheBlock’s “In/Out of the Money Around Price” (IOMAP) model suggests that there is a significant supply barrier ahead of Chainlink. Based on this on-chain metric, approximately 9,600 million addresses had previously purchased 7.5 million LINK between $7.6 and $7.8.
Such an important area of interest may have the ability to prevent this altcoin from reaching its upside potential. Holders within this price range would likely try to break even in their positions. If an upsurge can break past this barrier, then there are few hurdles ahead.
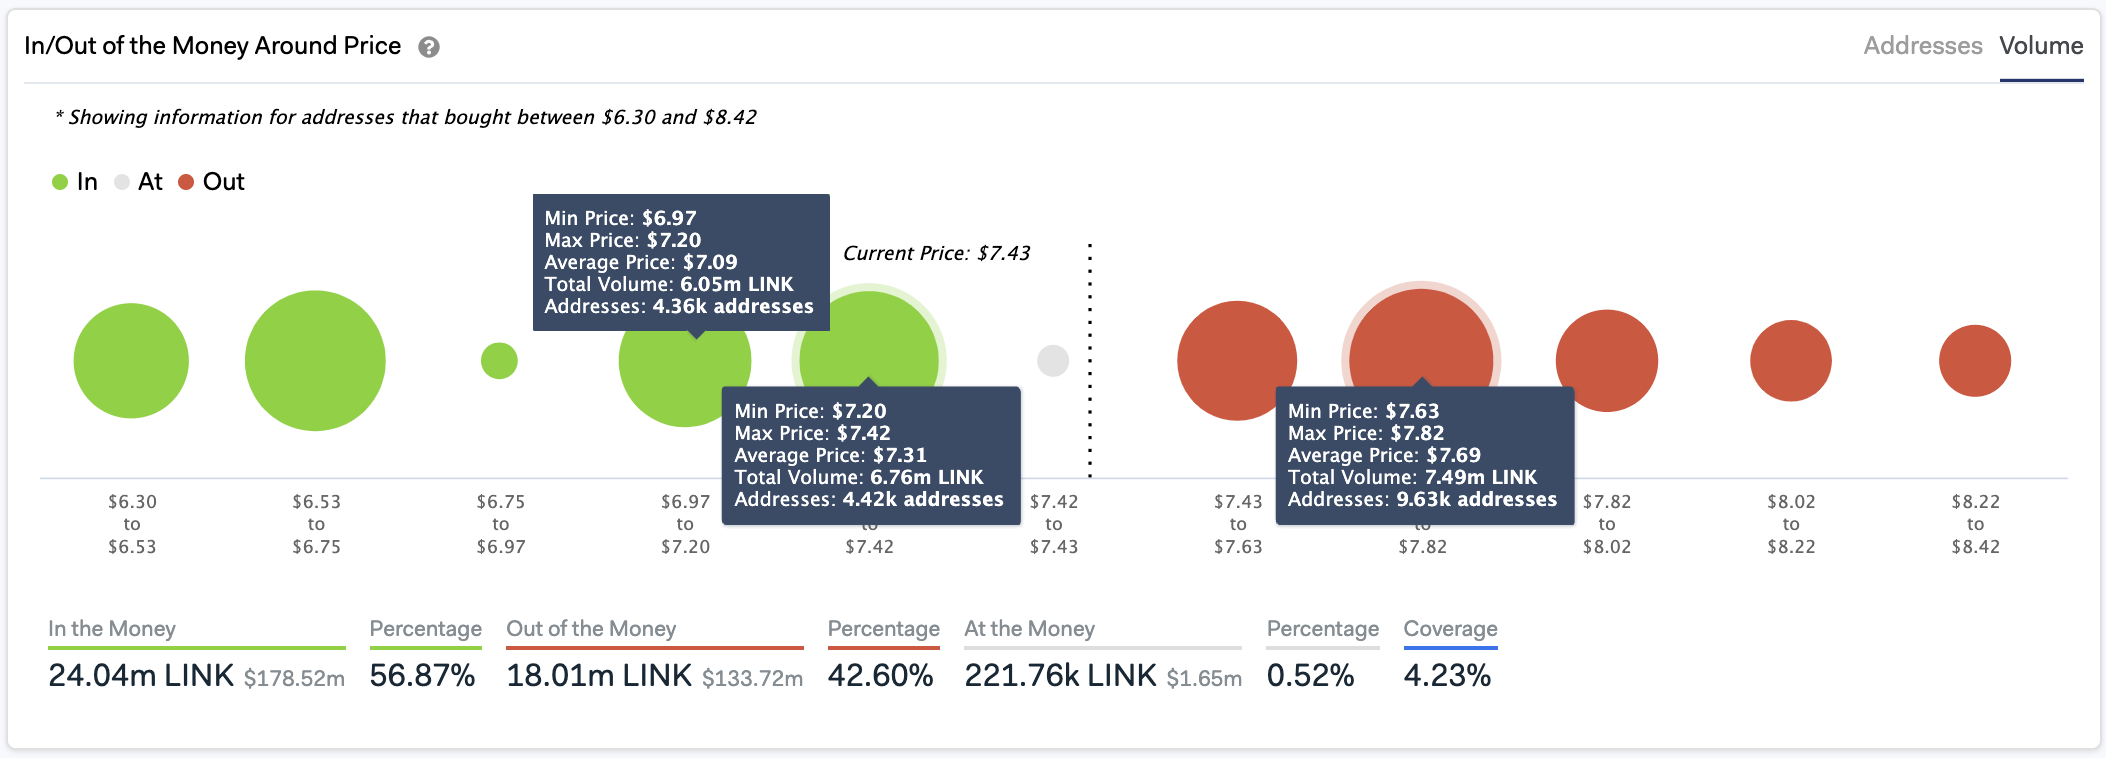
On the flip side, the IOMAP cohorts show that this cryptocurrency sits on top of comfortable support. Roughly 8,700 addresses bought 12.8 million LINK between $7 and $7.40. This massive supply barrier may have the ability to absorb downward price pressure.
It is worth mentioning that the recent bullish price action across the entire cryptocurrency market sent investors into “extreme greed,” based on the Crypto Fear and Greed Index. Historical data demonstrates that when crypto enthusiasts grow overwhelmingly bullish about the future, steep corrections follow.
Thus, traders must implement a robust risk management strategy when trading Chainlink to avoid adverse market conditions. Set your stop losses. Breaking below the $7.2 support level may result in a downswing towards $6.