 Earn with Nexo

Cosmos Price Analysis ATOM / USD: Rising Star
ATOM's price continues to rise.
- Cosmos now has a bullish short-term and medium-term trading bias
- The four-hour time frame shows that large inverted head and shoulders pattern is forming
- The daily time frame highlights that a major technical breakout has occurred
Cosmos continues its recent rise, with the ever-popular cryptocurrency now trading at its highest level since late-July this year. The ATOM / USD pair has been on a multi-day breakout and posting strong gains for eight of the last nine trading days.
The rally this week has added over twenty percent to Cosmos’s value, while the cryptocurrency now trading over ninety percent higher since October 25th.
What is potentially more impressive is the amount of possible upside left in the rally, as both the short and medium-term technicals for the ATOM / USD pair are pointing to further double-digit gains ahead.
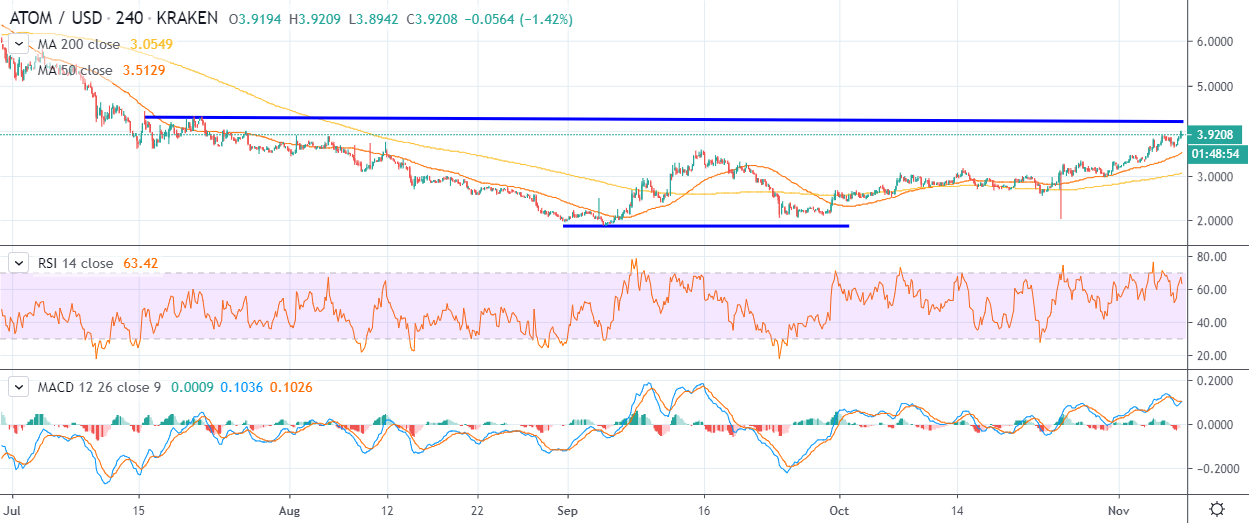
The four-hour time frame shows that the recent advance has helped to form a huge inverted head and shoulders pattern, which has the potential to propel Cosmos towards the $6.00 level.
A breakout above the $4.22 level is currently required to ignite the bullish pattern. Given the strong run higher it would not be unusual to see profit taking kick-in from around the $4.00 level before the rally resumes.
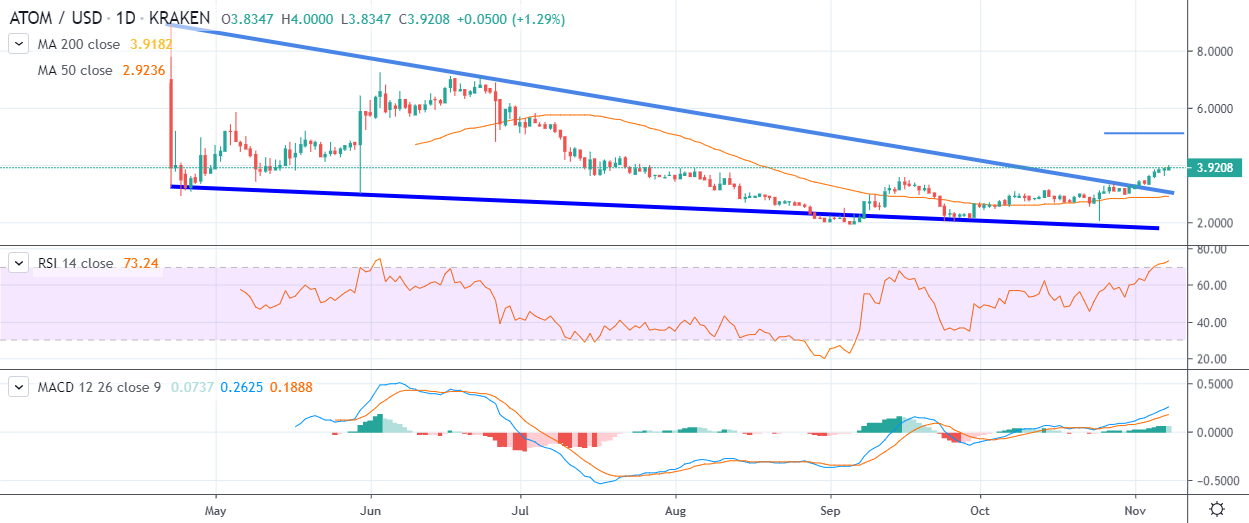
The daily time frame has been alluding to an upside breakout for the ATOM / USD pair for some time, with a bullish falling wedge pattern helping to predict the run higher we have seen in Cosmos over the last few weeks.
The falling wedge pattern suggests that a move towards the $6.00 level is certainly possible. The psychological $5.00 level will also be a favored target for medium-term bulls.
Overall, dip-buying is now favored, buying technical pullbacks towards the $3.20 level should be ideal to enter back into the long trade if a strong pullback from the $4.00 level occurs.
According to the latest sentiment data from TheTIE.io, the short-term sentiment towards Cosmos is bullish, at 66.00 %, while the overall long-term sentiment towards the cryptocurrency is also bullish, at 64.00%.
Upside Potential
The four-hour time frame shows that a large inverted head and shoulders pattern has formed, with the $4.22 level acting as the neckline of the bullish pattern.
Key technical resistance for the ATOM / USD pair above the bullish pattern is currently located at the $5.00 and the $6.00 levels.
Downside Potential
The four-hour time frame is showing that the ATOM / USD pair’s 50-period moving average on the four-hour time frame is currently providing the strongest form of short-term technical support, around the $3.50 level.
The daily time frame shows that the $3.00 level offers strong technical support and remains a key area that sellers may target if profit taking from the $4.22 level occurs.
Summary
Cosmos has superb technicals over both the short and medium-term, making it a firm favorite amongst traders and investors at the moment.
The $6.00 level is a likely medium-term target, with the $4.22 level the main near-term technical obstacle traders must overcome.
To get a quick refresher course on Cosmos check out our coin guide here. Our SIMETRI Research team has also published a full digital asset report on Cosmos.