 Earn with Nexo

Crypto.com Chain Price Analysis CRO / USD: Rolling Downhill
CRO is attempting to hold, but the market is a cruel mistress.
- Crypto.com Chain has a bearish short-term trading outlook, with the CRO / USD pair trading under key support
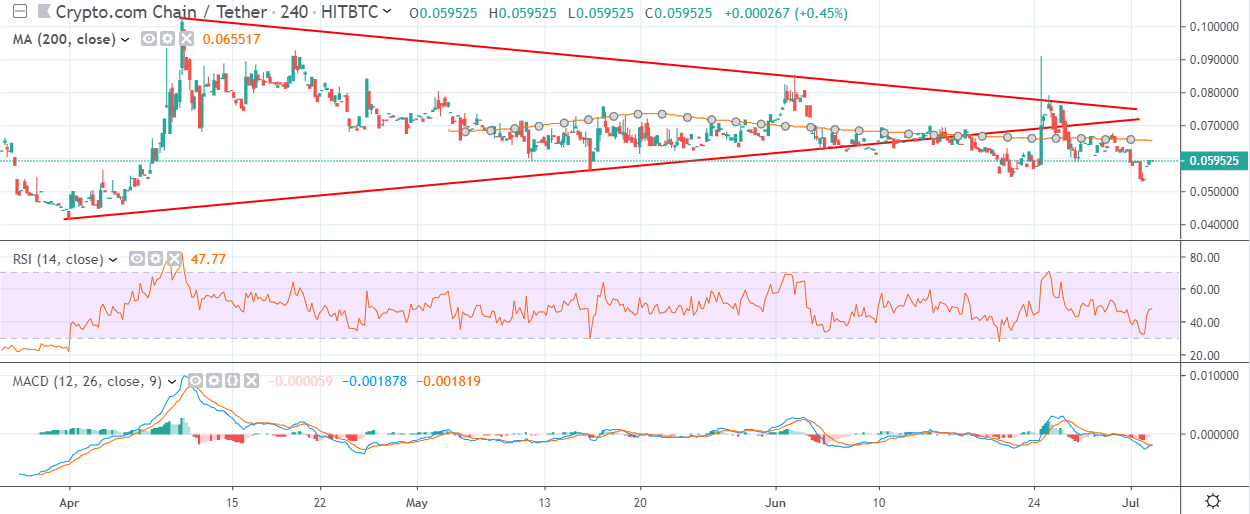
- The four-hour time frame shows that a bearish breakout has occurred from a triangle pattern
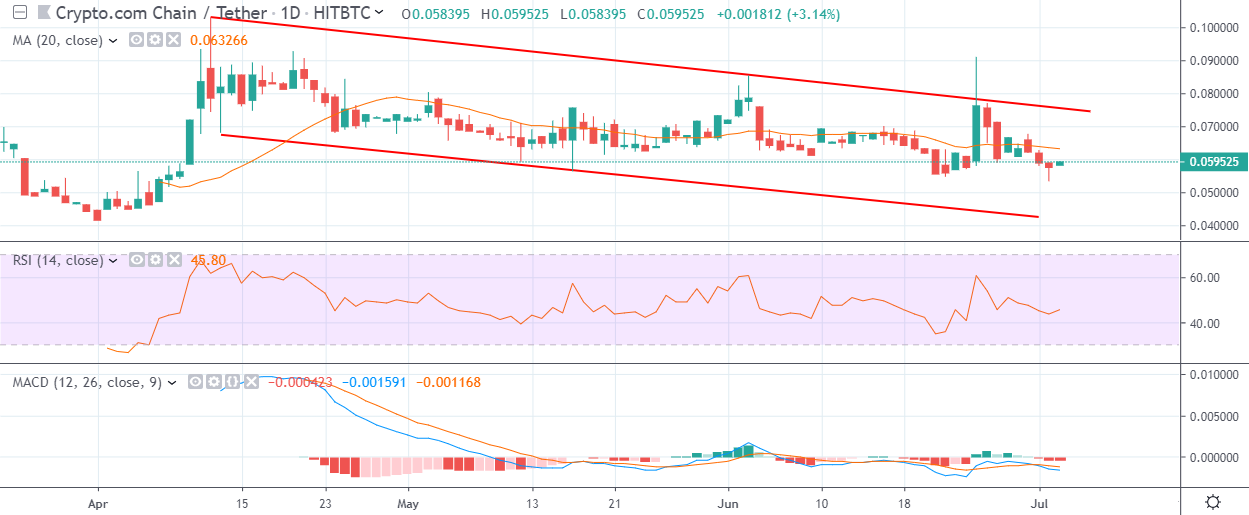
- The daily time frame shows that the CRO / USD pair is trading in the middle of a descending price channel
Fundamental Analysis
CRO is attempting to hold strong by continuing to get listed in exchanges. Last month the project was listed on Bithumb and Bibox, while a week ago the project announced its listing on OKEx. The trend will likely continue which will further add liquidity and drive demand for the token, though market dynamics are rolling back the temporary gains.
Crypto.com Chain / USD Short-term price analysis
Crypto.com Chain has a bearish short-term trading bias, with the CRO / USD pair falling below key technical support on the four-hour time frame.
The four-hour time frame is showing that the CRO / USD pair is coming under increasing technical selling pressure after falling below a neutral triangle pattern.
Technical indicators on the four-hour time frame are attempting to recover, but still remain bearish.
Pattern Watch
Traders should note that the April 2019 trading low is the overall downside target of the bearish triangle breakout.
Relative Strength Index
The Relative Strength Indicator on the four-hour time frame is attempting to move higher, but remains technically bearish.
MACD Indicator
The MACD indicator is attempting to recover higher, but still remains bearish on the four-hour time frame.
Crypto.com Chain / USD Medium-term price analysis
Crypto.com Chain has a bearish medium-term bias, with the CRO / USD pair continuing to erode its recent strong trading gains.
The daily time frame shows that the CRO / USD pair is trading in the middle of a descending price channel, following a strong technical rejection from the top of the channel.
Technical indicators across the daily time are turning lower and continue to generate a sell signal.
Pattern Watch
Traders should note that descending price channels are typically considered to be bullish patterns.
Relative Strength Index
The RSI indicator is bearish on the daily time frame and continues to trend lower.
MACD Indicator
The MACD indicator is bearish on the daily time frame and is currently generating a sell signal.
Conclusion
Crypto.com Chain is continuing to erode its recent strong gains, with the bearish breakout on the four-hour time frame weighing on the CRO / USD pair’s short-term technicals.
The daily time frame shows that sellers may be preparing to test the bottom of the descending price channel for a key test of overall demand.