 Earn with Nexo

DASH / USD Technical Analysis: Beware Of The Bear
DASH / USD Technical Analysis - Even if DASH is bullish in the short-term, indicators show that it's extremely overbought.
[vc_row][vc_column][vc_column_text]
- DASH is bullish in the short-term following a strong upside breakout from a falling wedge pattern
- Short-term technical indicators are showing bearish MACD price divergence
- Medium-term outlook for DASH remains bearish
DASH / USD Short-term price analysis
In the short-term DASH is bullish, following a strong upside breakout from a large falling wedge pattern seen across the lower time frame. Price is also trading above all key short-term moving averages.
A degree of caution is still warranted when trading DASH / USD in the short-term, as a bearish price divergence is evident on the four-hour time frame while the Relative Strength Index shows that the pair has reached extreme overbought conditions.
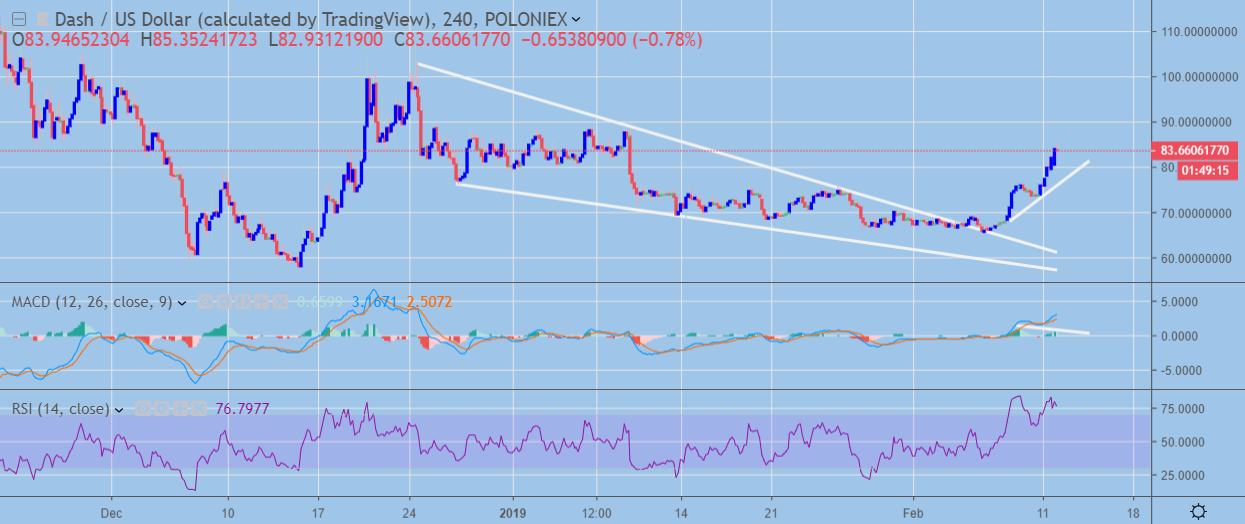 DASH / USD H4 Chart (Source: TradingView)
Pattern Watch
Traders should watch for a potential test of the falling wedge patterns upper trendline if the DASH / USD pair starts to turn lower over the coming trading sessions.
MACD Indicator
The MACD indicator is showing bearish price divergence across the four-hour time frame.
DASH / USD Medium-term price analysis
In the medium-term, DASH is bearish with the recent up move in the cryptocurrency failing to make any real impact on the overall bearish longer-term downtrend already underway in the pair.
The daily time frame clearly shows two distinct trading patterns, a smaller falling wedge pattern and a much larger falling wedge pattern which has already broken to the downside.
A further advance towards the larger falling wedge pattern cannot be discounted at this stage, although some indicators on the daily time are starting to appear overstretched.
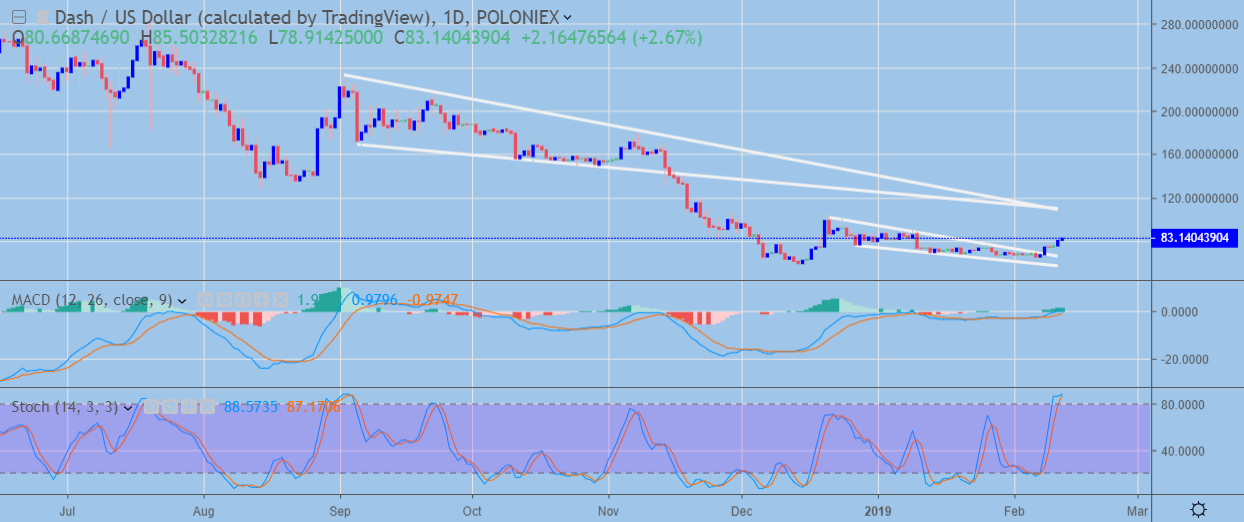 DASH / USD Daily Chart (Source: TradingView)
Pattern Watch
Aside from the falling wedge pattern, a bullish double-bottom pattern may be forming, after sellers’ failed attempt to breach the pair’s December 2018 trading low.
Key Moving Averages
The DASH / USD pair is still trading below its 200-day moving average, so the overall theme of medium and longer-term weakness is still intact.
MACD Indicator
The MACD indicator is bullish on the daily time frame with scope for significant upside.
Stochastic
The Stochastic Indicator on the mentioned time frame has reached extreme oversold conditions and is conflicting with the MACD indicator.
Conclusion
DASH is showing signs of being overstretched in the short-term with bearish MACD price divergence building across the lower time frames.
The medium-term outlook remains bearish until the pair starts to trade above its 200-day moving average. It is certainly worth closely observing any technical pullbacks in this pair for signs that a second major price floor may be in place.
Decentral Media, Inc., the publisher of Crypto Briefing, is not an investment advisor and does not offer or provide investment advice or other financial advice. Nothing on this website constitutes, or should be relied on as, investment advice or financial advice of any kind. Specifically, none of the information on this website constitutes, or should be relied on as, a suggestion, offer, or other solicitation to engage in, or refrain from engaging in, any purchase, sale, or any other any investment-related activity with respect to any transaction. You should never make an investment decision on an investment based solely on the information on our website, and you should never interpret or otherwise rely on any of the information on this website as investment advice. We strongly recommend that you consult a licensed investment advisor or other qualified financial professional if you are seeking investment advice on an investment.
[/vc_column_text][/vc_column][/vc_row]