 Earn with Nexo

Enigma Price Analysis ENG / USD: No Longer Secret
Enigma is attracting attention with its testnet successes.
- Enigma has a bullish short-term bias, with the cryptocurrency moving back towards its current 2019 trading high
- The four-hour time frame shows that a bullish pattern is now in the process of forming
- The daily time frame highlights an inverted head and shoulders pattern with a large upside projection
Fundamental Analysis
ENG is holding strong following the release of the second testnet for the “Secret Contract” Blockchain last month. According to the team, the testnet has accumulated over 500 downloads in the second half of June, showcasing early interest from dApp developers.
The project plans to launch its mainnet by the end of 2019 and will be holding multiple hackathons and other developer initiatives in the second half of the year, which could generate additional interest from investors.
Enigma / USD Short-term price analysis
Enigma has a bullish short-term bias, with the cryptocurrency edging closer to its current 2019 trading high.
The four-hour time frame shows that a bullish inverted head and shoulders pattern is close to forming, as the ENG / USD pair continues its recent upside recovery.
Technical indicators on the four-hour time frame are rising and have a definite bullish bias.
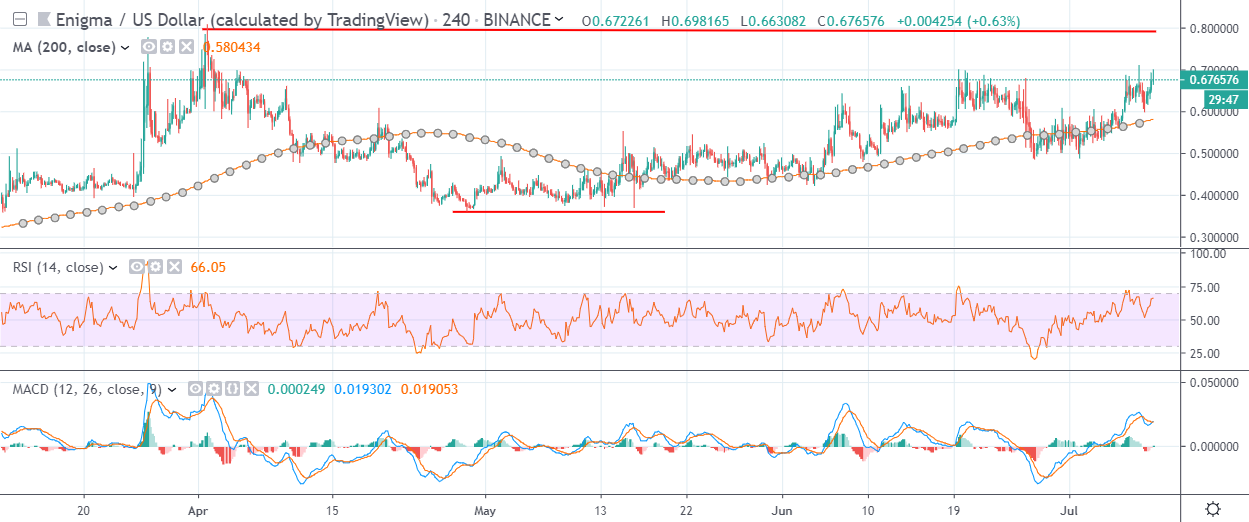
Pattern Watch
Traders should note that the ENG / USD pair could double in value if the bullish pattern on the four-hour time frame is ignited to its full upside potential.
Relative Strength Index
The RSI indicator on the four-hour time frame is bullish and continues to point to further short-term gains.
MACD Indicator
The MACD indicator on the four-hour time frame is rising and has a slight bullish bias.
Enigma / USD Medium-term price analysis
Enigma has a bullish medium-term outlook, with the ENG / USD pair on course for a fifth consecutive day of trading gains.
The daily time frame shows the presence of a large inverted head and shoulders pattern, with a sizeable upside projection. Buyers will need to breach the current 2019 trading high to trigger the bullish pattern into action.
Technical indicators on the daily time frame are starting to turning increasingly bullish and continue to point to further medium-term upside for the ENG / USD pair.
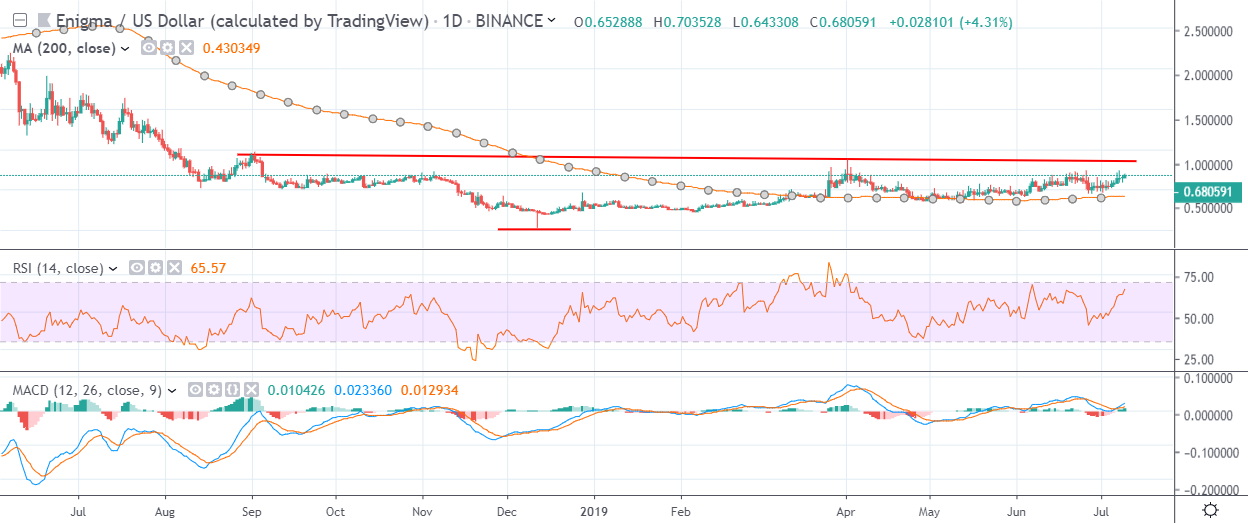
Pattern Watch
Trades should note that the June 2018 swing-high is the overall upside target of the large bullish pattern on the daily time frame.
Relative Strength Index
The RSI indicator on the daily time frame is bullish and is currently issuing a strong buy signal.
MACD Indicator
The MACD indicator is bullish on the daily time frame, with both the MACD signal line and histogram issuing a buy signal.
Conclusion
Enigma is starting to appear increasingly strong across both time horizons, with the inverted head and shoulders pattern on the four-hour and daily time frame pointing to an upcoming bullish breakout.
Technical indicators are also adding confirmation that the path of least resistance is currently to the upside.