 Earn with Nexo

EOS / USD Technical Analysis: Mixed Signals
EOS / USD Technical Analysis - Patterns indicate bullishness, but other indicators remain neutral or bearish.
[vc_row][vc_column][vc_column_text]
- EOS has a bullish short-term bias, with the cryptocurrency still trading above its 200-period moving average on the four-hour time frame
- The four-hour time frame also shows price trapped inside a bullish ascending triangle pattern
- The EOS / USD pair’s medium-term outlook is bearish with bulls unable to hold price above its 200-day moving average
EOS / USD Short-term price analysis
EOS is bullish in the short-term, with the cryptocurrency managing to trade above its 200-period moving average on the four-hour time frame since February 8th this year.
The four-hour time frame is increasingly interesting, with price trapped inside an ascending triangle pattern, which is typically a bullish trading pattern.
Technical indicators on the four-hour time frame currently show no clear trading bias and are holding close to neutral levels.
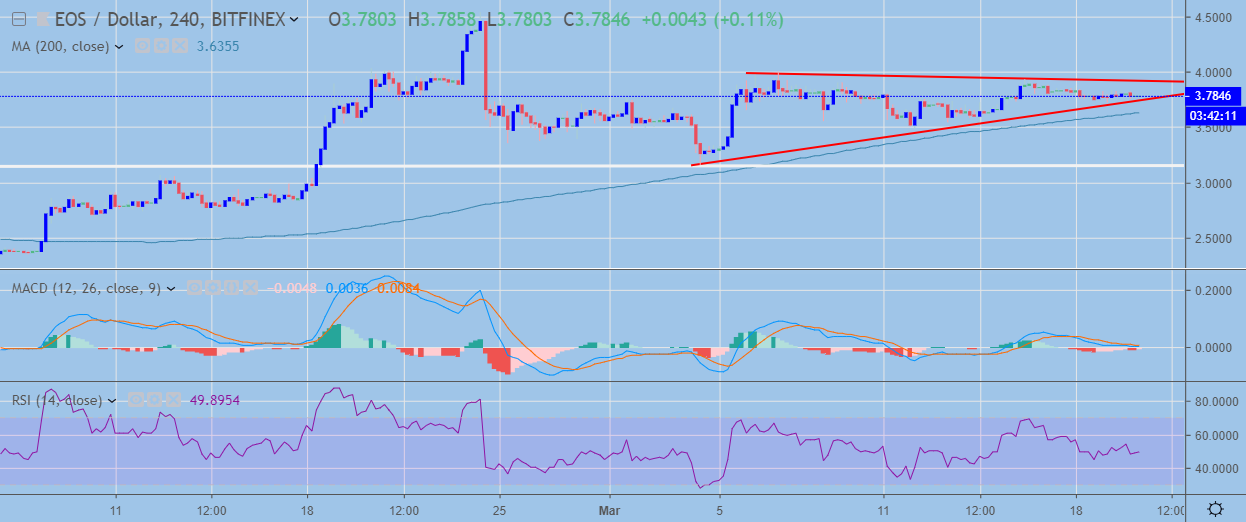 EOS / USD H4 Chart (Source: TradingView)
Pattern Watch
Traders should note that a potential bearish head and shoulders pattern and an inverted head and shoulders pattern are both present on the four-hour time frame.
MACD
The MACD indicator is neutral on the four-hour time frame and currently showing no clear trading bias.
Relative Strength Index
The RSI indicator is also neutral on the four-hour time frame and is failing to generate a clear trading signal.
EOS / USD Medium-term price analysis
EOS has a neutral trading bias over the medium-term, with the cryptocurrency still unable to perform multiple daily price closes above its key 200-day moving average
The EOS / USD pair has been in a period of consolidation after hitting its upside target in February, which also eroded any bullish divergence on the daily time frame chart.
An ascending triangle pattern is also present on the daily time frame, which could signal a potential technical test of the February trading high.
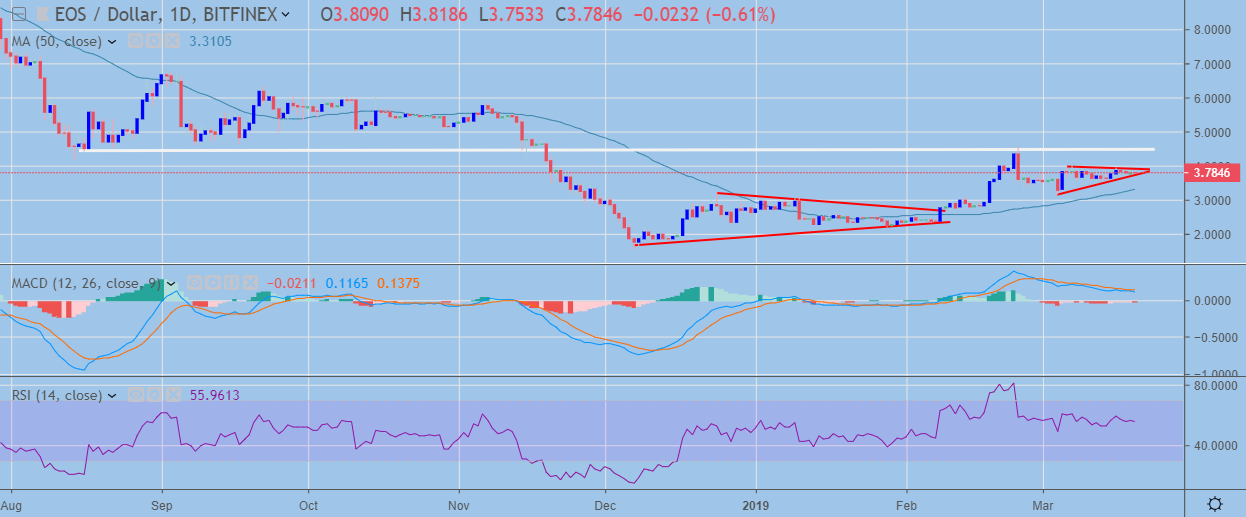 EOS / USD Daily Chart (Source: TradingView)
Pattern Watch
Traders should note the size of the ascending price channel on the daily time frame would take the EOS / USD pair towards major trendline resistance.
MACD
The MACD indicator on the daily time frame is neutral and is currently failing to generate a clear trading signal.
Relative Strength Index
The Relative Strength Index has a slight bullish bias and is holding above neutral.
Conclusion
EOS has moved into a period of price consolidation, with both time frames showing the EOS / USD pair trapped inside an ascending triangle pattern.
While the ascending triangle pattern suggests a bullish move might occur, some caution is advised as price is trading below the EOS / USD pair’s 200-day moving average and a bearish head and shoulders pattern is taking shape on the four-hour time frame.
Decentral Media, Inc., the publisher of Crypto Briefing, is not an investment advisor and does not offer or provide investment advice or other financial advice. Nothing on this website constitutes, or should be relied on as, investment advice or financial advice of any kind. Specifically, none of the information on this website constitutes, or should be relied on as, a suggestion, offer, or other solicitation to engage in, or refrain from engaging in, any purchase, sale, or any other any investment-related activity with respect to any transaction. You should never make an investment decision on an investment based solely on the information on our website, and you should never interpret or otherwise rely on any of the information on this website as investment advice. We strongly recommend that you consult a licensed investment advisor or other qualified financial professional if you are seeking investment advice on an investment.
[/vc_column_text][/vc_column][/vc_row]