
Ethereum Price Analysis ETH / USD: Preparing For Eruption
Ethereum is under short-term pressure that could potentially bring it below $200, but the medium-term shows $500 as possible target.
- Ethereum has a bullish short-term trading bias, with the ETH / USD pair recovering higher after a brief technical pullback
- The ETH / USD pair has a bullish medium-term bias and may target towards the $500.00 level
- The daily time frame highlighting the $320.00 level as the next upside target
Ethereum / USD Short-term price analysis
Ethereum has a bullish short-term trading bias, with the cryptocurrency recovering higher after a brief technical correction back towards the $220.00 level.
The four-hour time frame shows that a bearish double-top pattern has formed, with the ETH / USD bulls now needing to move price above the $280.00 level to invalidate the bearish pattern.
Technical indicators across the four-hour time frame still have a slight bearish bias.
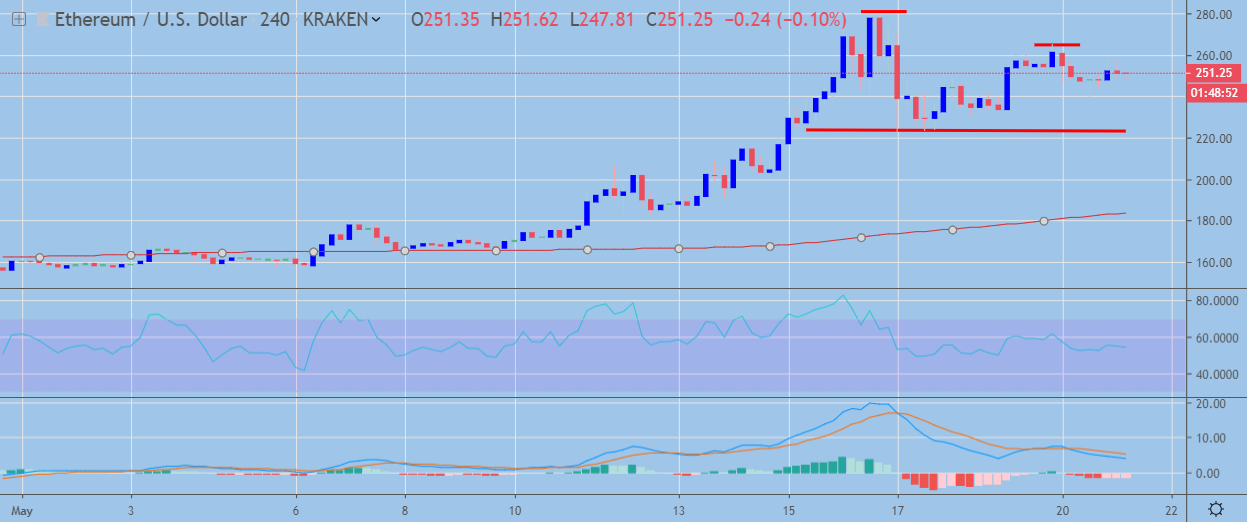 ETH / USD H4 Chart by TradingView
Pattern Watch
Traders should note that sellers may target the $180.00 support level if the bearish double-top pattern is triggered.
Relative Strength Index
The RSI indicator on the four-hour time frame remains bullish, although bearish pressure is building.
MACD Indicator
The MACD indicator on the four-hour time frame is still turning lower and holds a slight downward bias.
Ethereum / USD Medium-term price analysis
Ethereum has a bullish medium-term trading bias, with the ETH / USD pair still trading well above its 200-day moving average on the daily time frame.
The daily time frame is showing that ETH / USD bulls are still maintaining price above the neckline of the recently created inverted head and shoulders pattern.
Technical indicators on the daily time frame appear overstretched and may need to correct from overbought conditions before the next upside rally can commence.
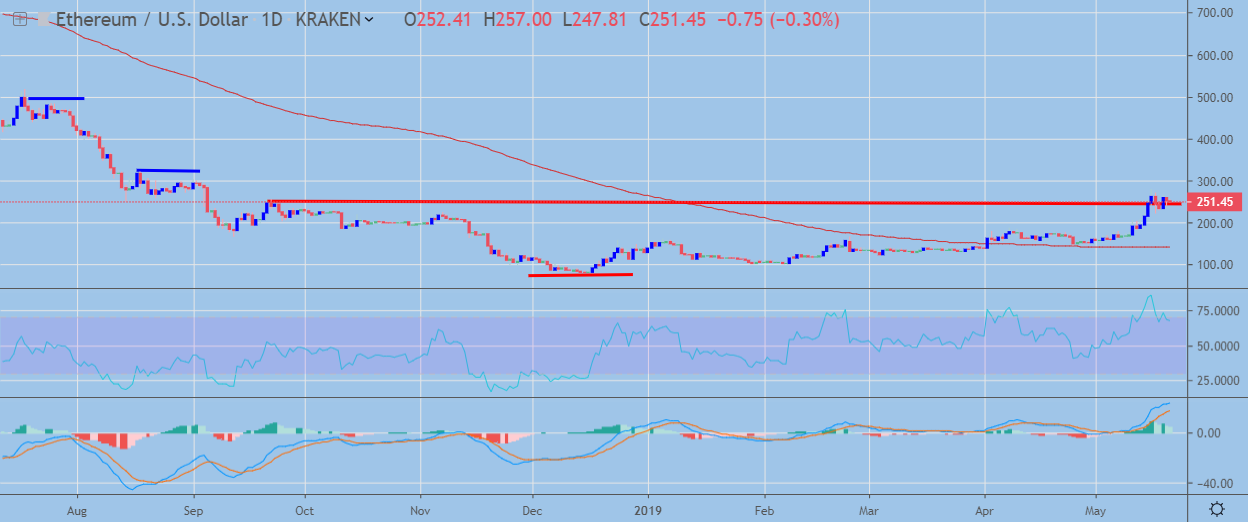 ETH / USD Daily Chart by TradingView
Pattern Watch
Traders should note that the inverted head and shoulders pattern on the daily time frame shows the $320.00 and $500.00 levels as possible upside targets.
Relative Strength Index
The RSI Indicator on the daily time frame remains bullish, although it has moved into overbought territory.
MACD Indicator
The MACD indicator on the daily time frame is bullish, although the MACD signal line appears overstretched.
Conclusion
Ethereum bulls now need to invalidate the bearish double-top on the four-hour time frame to encourage fresh technical buying in the ETH / USD pair.
The medium-term prospects for Ethereum still appear extremely bullish, with the inverted head and shoulders pattern on the daily time pointing to the $320.00 and $500.00 levels as possible bullish targets.